Car insurance rates across the U.S. are higher than ever. The Zebra reveals the latest data, trends impacting rates, and which drivers pay the most, based on an analysis of 73 million rates.
… is how much the average U.S. driver is paying for car insurance this year. Rates vary based on where you live, what car you drive, how you drive, and who you are.
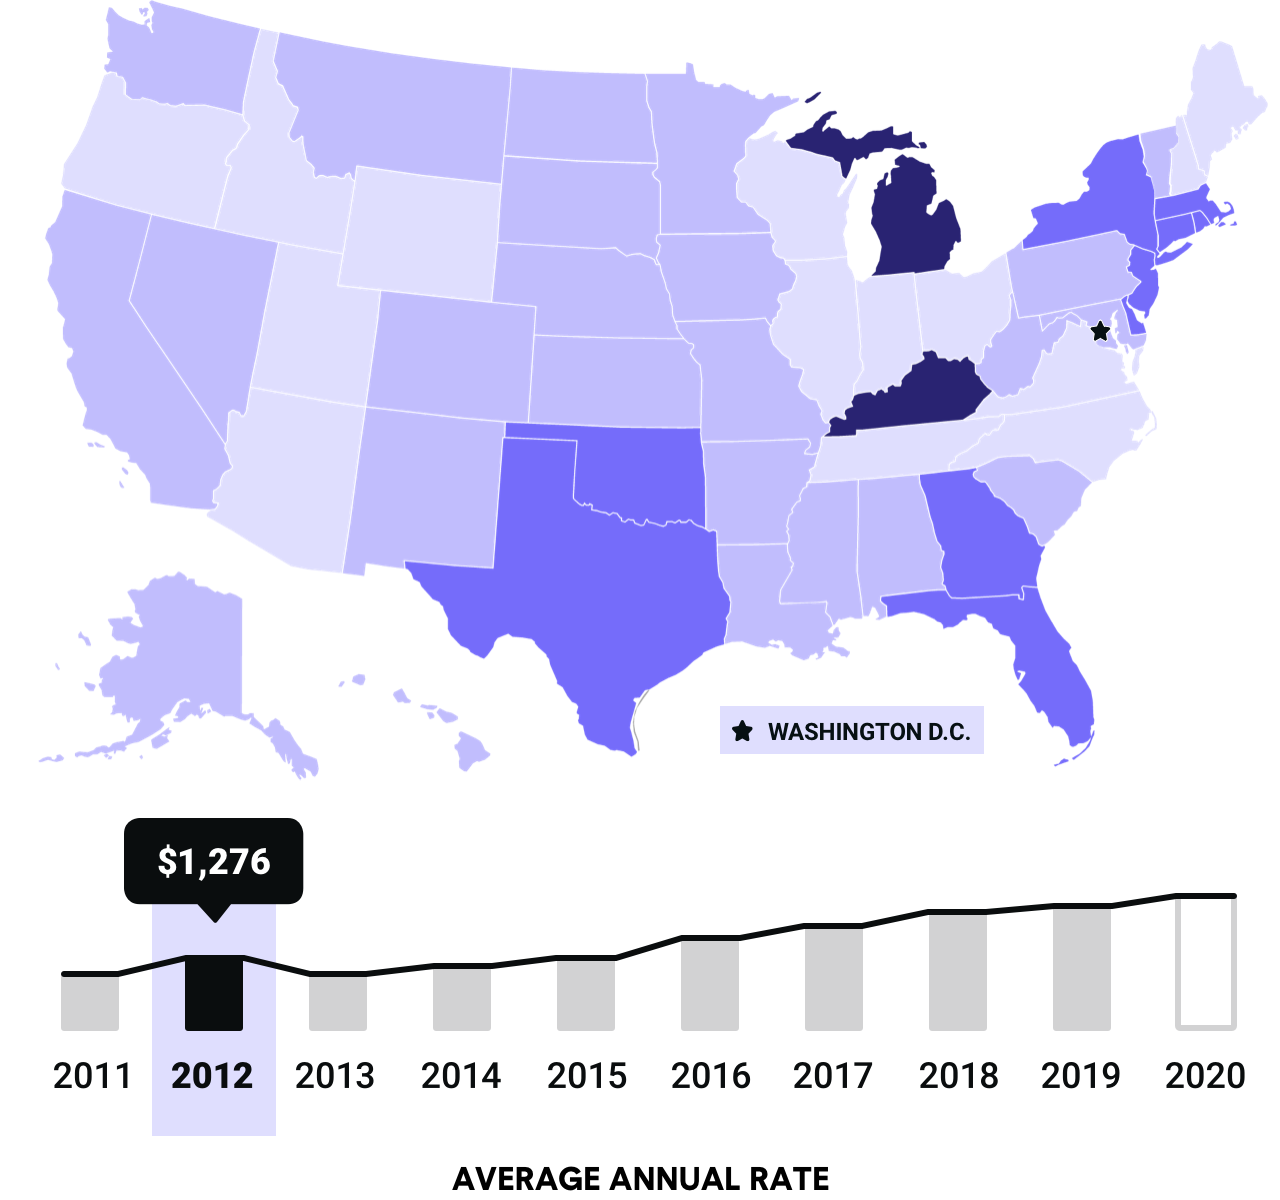
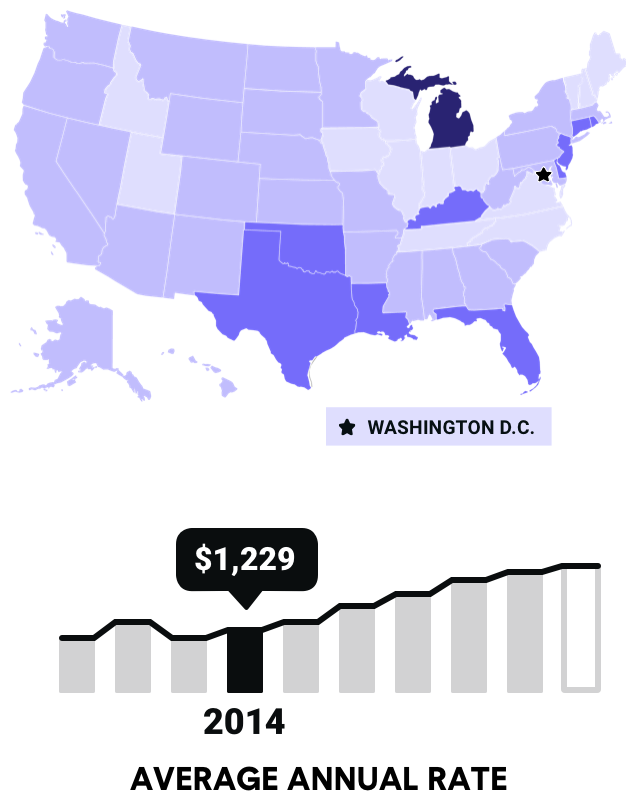
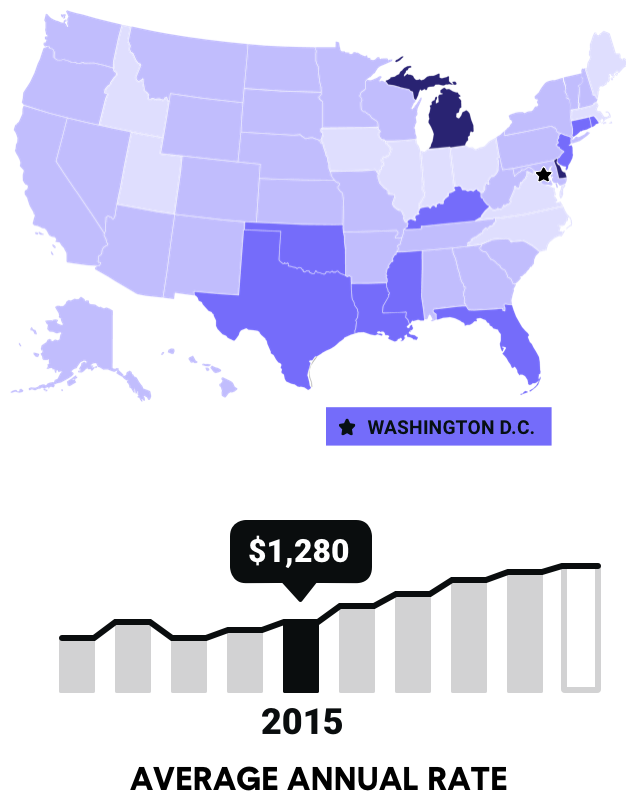
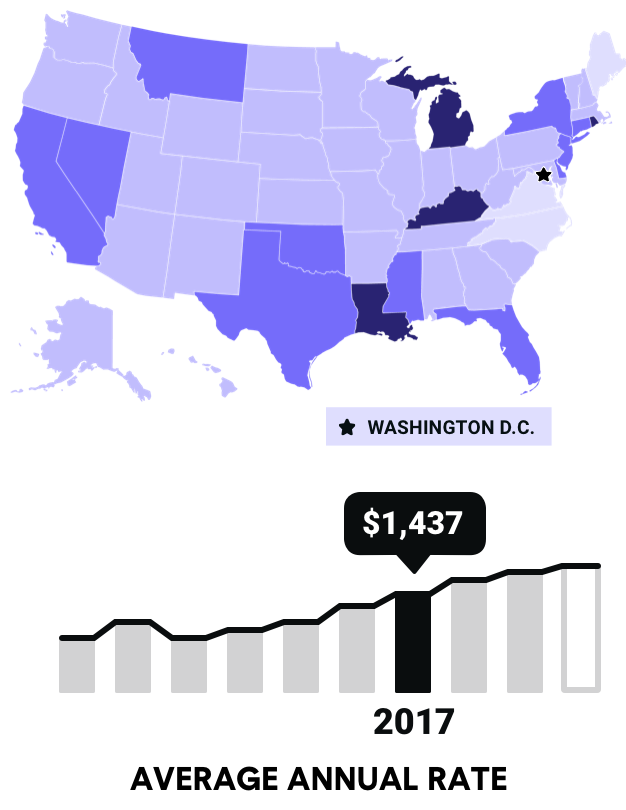
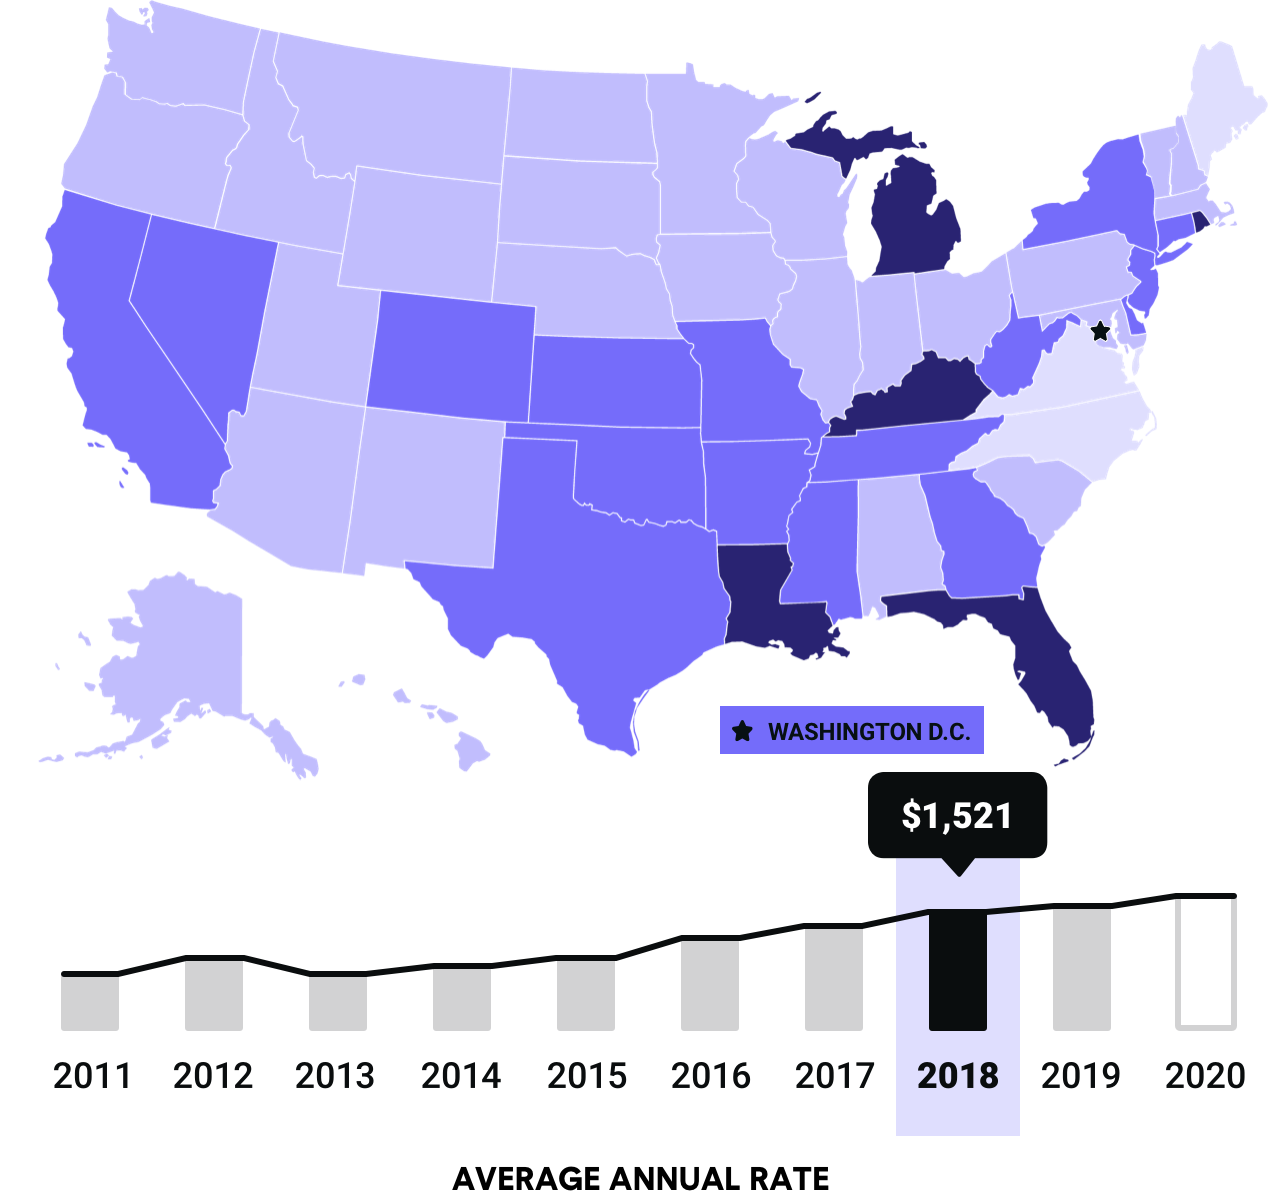
Car insurance rates are rising in the U.S.
Since 2011, rates have skyrocketed 29.6% nationally, though the impacts differ across the U.S. Seven states have seen small rate decreases since 2011, while 44 states and Washington D.C. experienced increases (up to 86%).
Rate Ranges
$600 - $1,000
$1,001 - $1,500
$1,501 - $2,000
$2,001 +
Where are car insurance rates rising or falling?
In the past year, car insurance got more expensive in 33 states and less expensive in 18 states (including Washington D.C.). South Dakota saw the biggest year-over-year rate increase at 22%, while Texas saw the biggest decrease at -20%.
Rate Changes
Increased year over year
Decreased year over year
Rate Changes
Increased year over year
Decreased year over year
What does car insurance cost in your state? Click to see rates where you live.
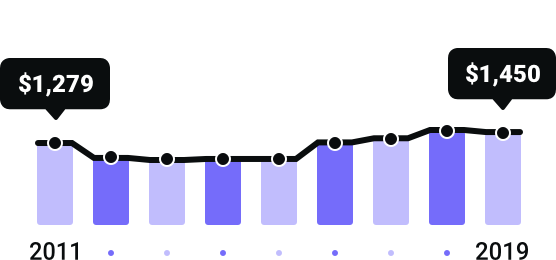
Alabama
$1,450
Fairfield ($1,688)
Opp ($1,265)
Alabama Rates Since 2011
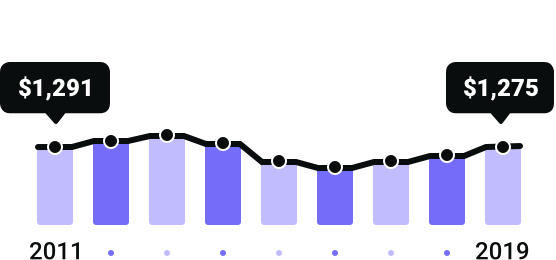
Alaska
$1,275
Chugiak ($1,509)
Ward Cove ($1,020)
Alaska Rates Since 2011
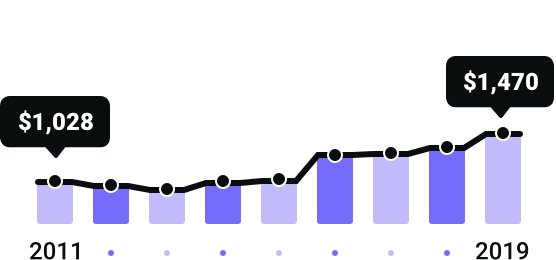
Arizona
$1,470
Cashion ($1,831)
Topock ($1,147)
Arizona Rates Since 2011
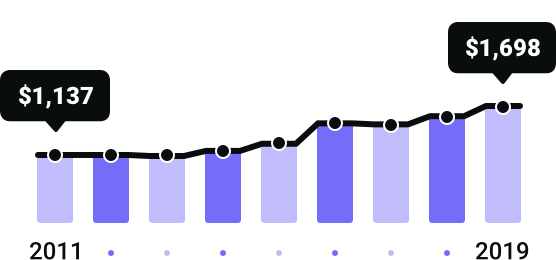
Arkansas
$1,698
College Station ($2,023)
Sulphur Springs ($1,530)
Arkansas Rates Since 2011
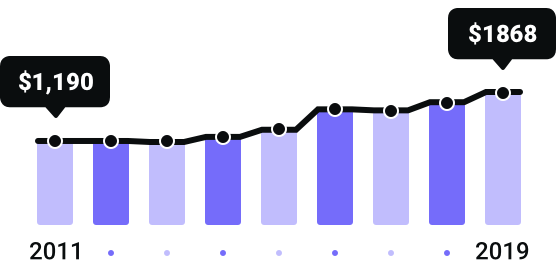
California
$1,868
Tarzana ($2,938)
Mount Shasta ($1,383)
California Rates Since 2011
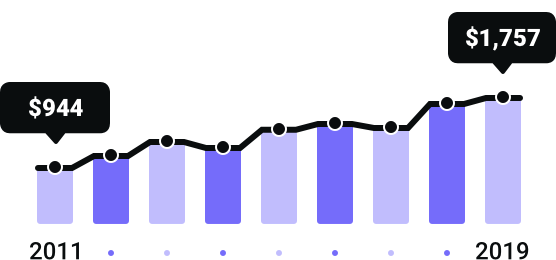
Colorado
$1,757
Pueblo ($2,183)
Fruita ($1,377)
Colorado Rates Since 2011
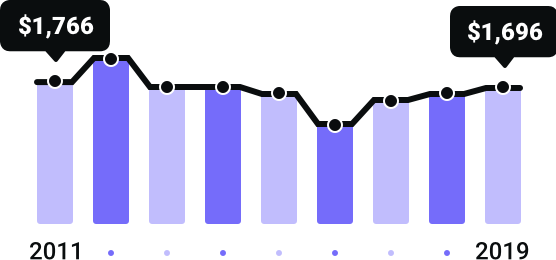
Connecticut
$1,696
New Haven ($2,250)
Old Lyme ($1,467)
Connecticut Rates Since 2011
Delaware
$1,803
Delaware City ($2,255)
Selbyville ($1,529)
Delaware Rates Since 2011
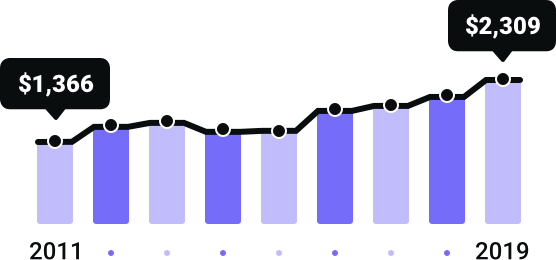
Florida
$2,309
Brownsville ($3,327)
Santa Rosa Beach ($1,793)
Florida Rates Since 2011
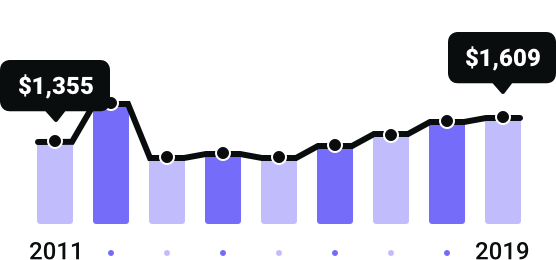
Georgia
$1,609
Redan ($2,218)
Dasher ($1,275)
Georgia Rates Since 2011
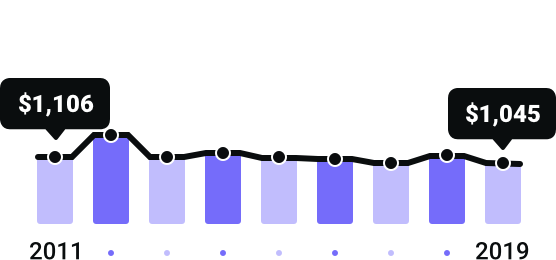
Hawaii
$1,045
Hilo ($1,121)
Waimea ($898)
Hawaii Rates Since 2011
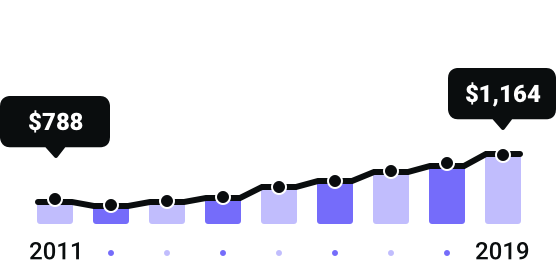
Idaho
$1,164
Kooskia ($1,297)
Meridian ($1,040)
Idaho Rates Since 2011
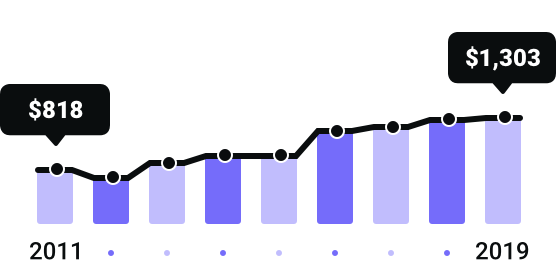
Illinois
$1,303
Dolton ($1,957)
Pontiac ($1,111)
Illinois Rates Since 2011
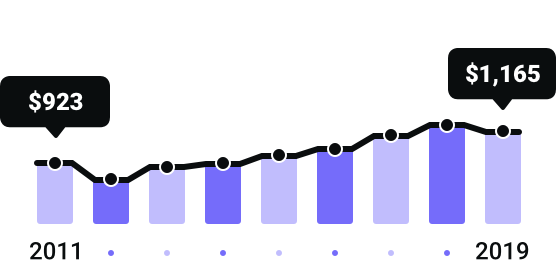
Indiana
$1,165
East Chicago ($1,609)
Decatur ($1,027)
Indiana Rates Since 2011
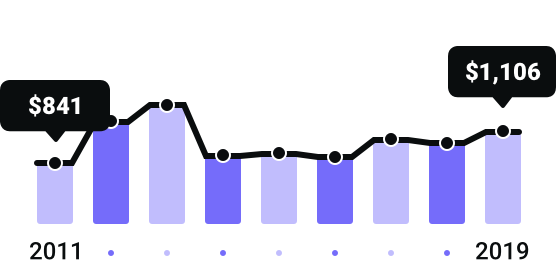
Iowa
$1,106
Council Bluffs ($1,402)
Grimes ($924)
Iowa Rates Since 2011
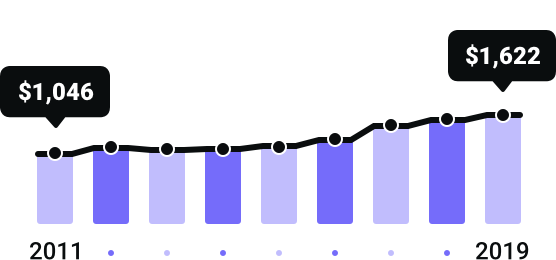
Kansas
$1,622
Ingalls ($1,922)
Salina ($1,435)
Kansas Rates Since 2011
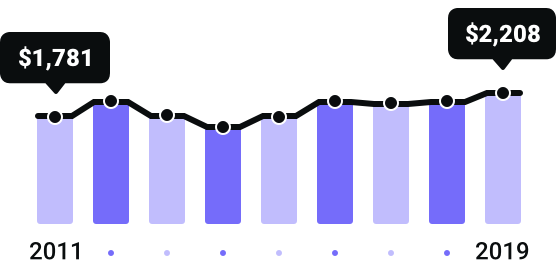
Kentucky
$2,208
Lookout ($3,284)
Fort Thomas ($1,581)
Kentucky Rates Since 2011
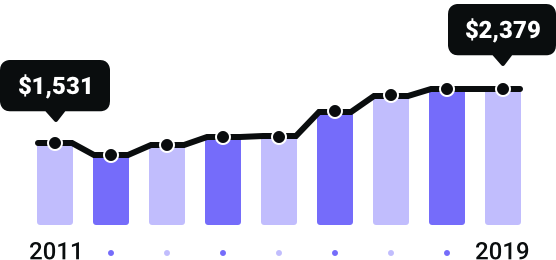
Louisiana
$2,379
New Orleans ($3,735)
Cullen ($1,803)
Louisiana Rates Since 2011
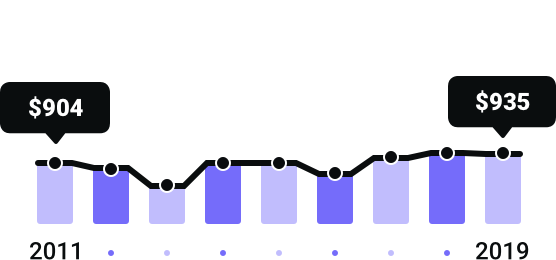
Maine
$935
Isle of Springs ($1,033)
Bridgewater ($862)
Maine Rates Since 2011
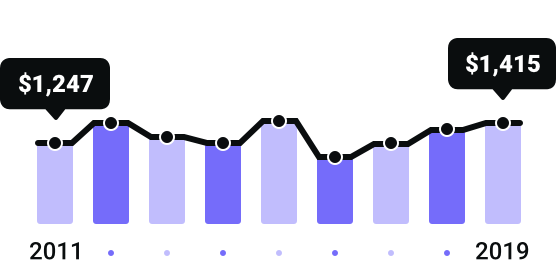
Maryland
$1,415
Randallstown ($2,132)
Cavetown ($1,143)
Maryland Rates Since 2011
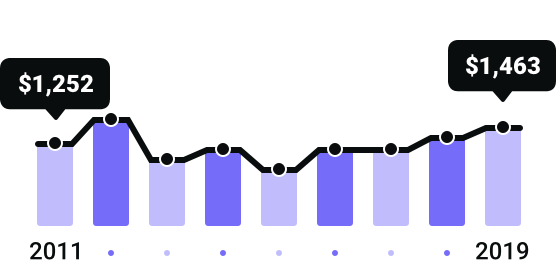
Massachusetts
$1,463
Roxbury ($2,785)
Gill ($1,085)
Massachusetts Rates Since 2011
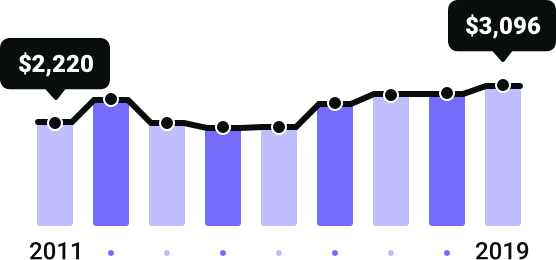
Michigan
$3,096
Detroit ($6,280)
Shoreham ($2,302)
Michigan Rates Since 2011
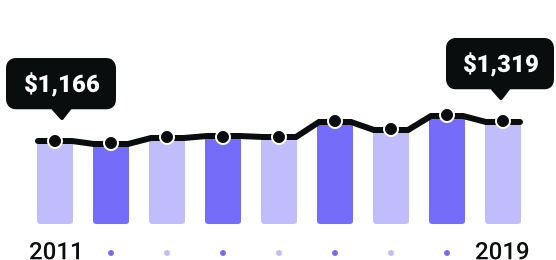
Minnesota
$1,319
St. Paul ($1,663)
New Ulm ($1,141)
Minnesota Rates Since 2011
Mississippi
$1,587
Hermanville ($1,841)
Crawford ($1,395)
Mississippi Rates Since 2011
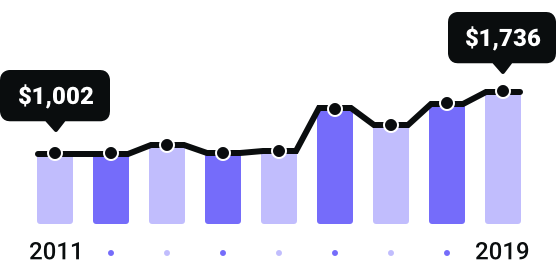
Missouri
$1,736
Pine Lawn ($2,808)
Lohman ($1,498)
Missouri Rates Since 2011
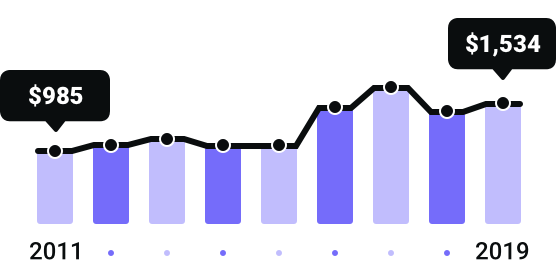
Montana
$1,534
Wyola ($1,710)
East Helena ($1,344)
Montana Rates Since 2011
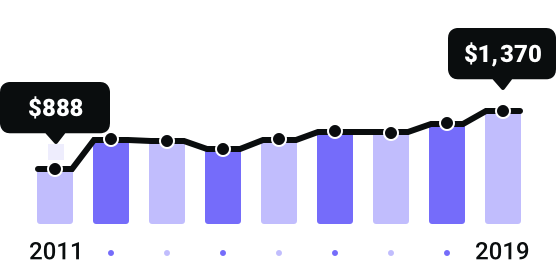
Nebraska
$1,370
Melbeta ($1,680)
Columbus ($1,209)
Nebraska Rates Since 2011
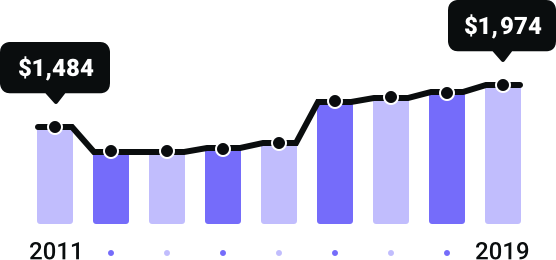
Nevada
$1,974
Spring Valley ($2,853)
Winnemucca ($1,411)
Nevada Rates Since 2011
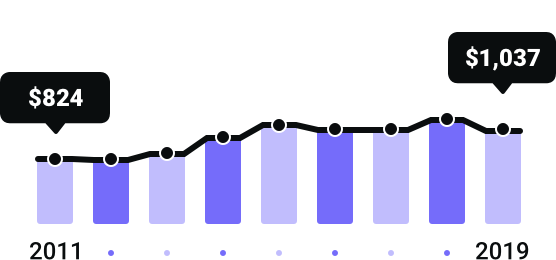
New Hampshire
$1,037
Newton ($1,234)
Contoocook ($950)
New Hampshire Rates Since 2011
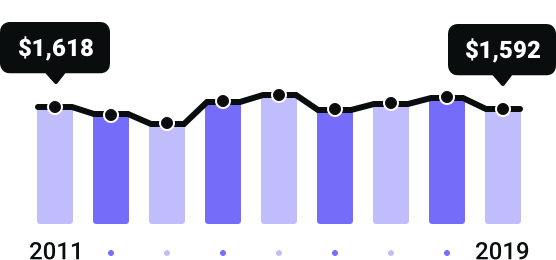
New Jersey
$1,592
Newark ($2,409)
Manasquan ($1,360)
New Jersey Rates Since 2011
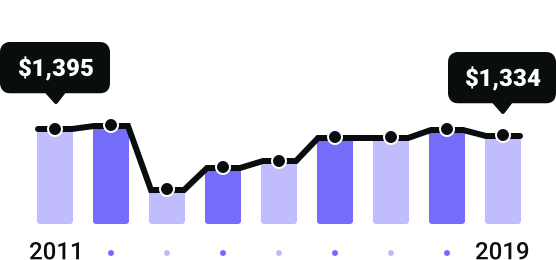
New Mexico
$1,334
Albuquerque ($1,556)
Alamogordo ($1,136)
New Mexico Rates Since 2011
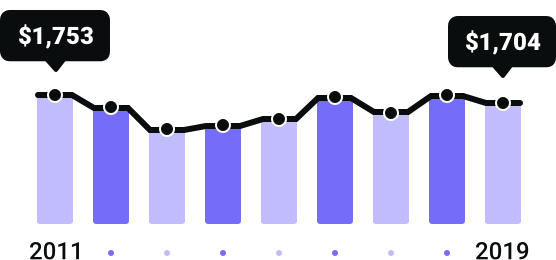
New York
$1,704
Brooklyn ($3,745)
Corning ($1,103)
New York Rates Since 2011
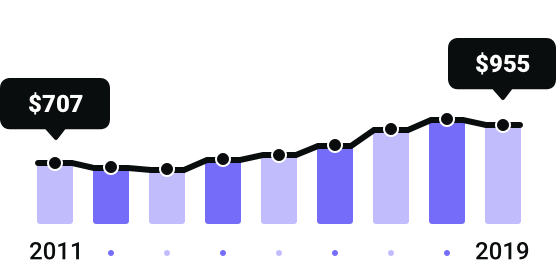
North Carolina
$955
Newell ($1,256)
Candler ($804)
North Carolina Rates Since 2011
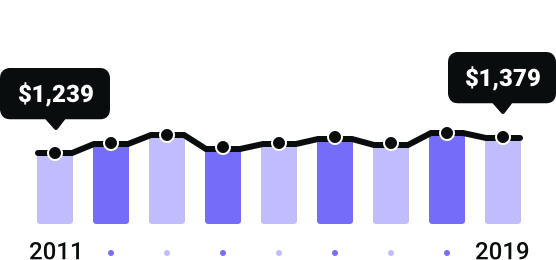
North Dakota
$1,379
Fort Yates ($1,586)
West Fargo ($1,188)
North Dakota Rates Since 2011
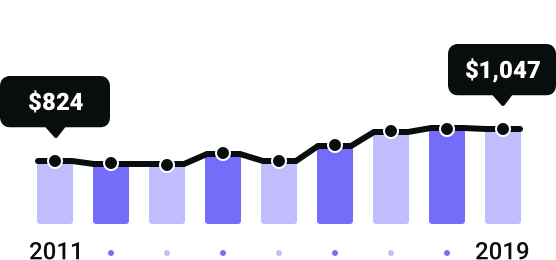
Ohio
$1,047
Youngstown ($1,250)
St. Marys ($869)
Ohio Rates Since 2011
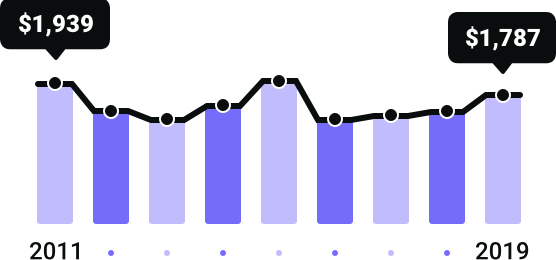
Oklahoma
$1,787
Nichols Hills ($2,021)
Indiahoma ($1,631)
Oklahoma Rates Since 2011
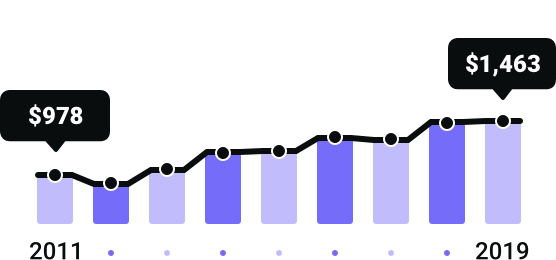
Oregon
$1,463
Gresham ($1,944)
La Grande ($1,283)
Oregon Rates Since 2011
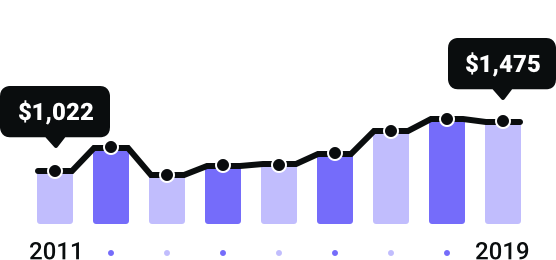
Pennsylvania
$1,475
Philadelphia ($2,647)
Houserville ($1,175)
Pennsylvania Rates Since 2011
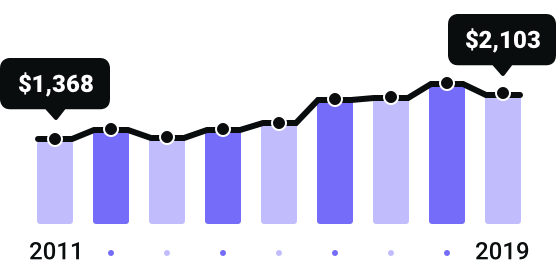
Rhode Island
$2,103
Providence ($2,820)
Newport ($1,597)
Rhode Island Rates Since 2011
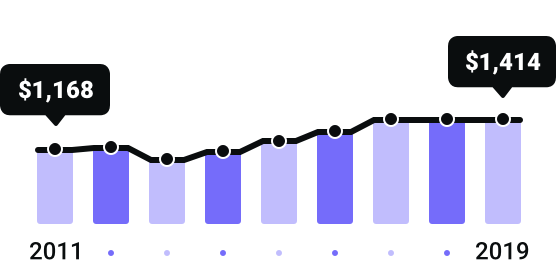
South Carolina
$1,414
Crocketville ($1,779)
Central ($1,142)
South Carolina Rates Since 2011
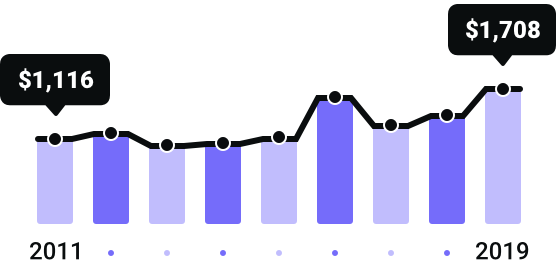
South Dakota
$1,708
Oglala ($2,186)
Watertown ($1,407)
South Dakota Rates Since 2011
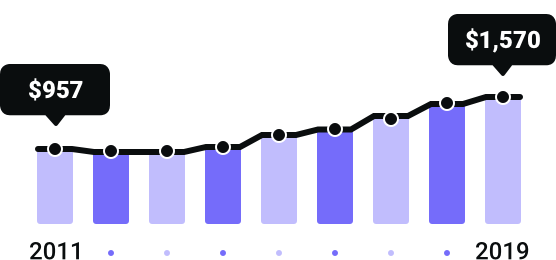
Tennessee
$1,570
Memphis ($1,949)
Colonial Heights ($1,303)
Tennessee Rates Since 2011
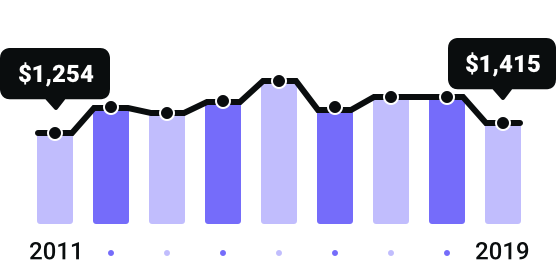
Texas
$1,415
Aldine ($1,804)
Christoval ($1,195)
Texas Rates Since 2011
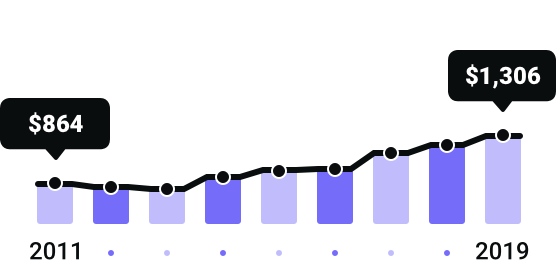
Utah
$1,306
South Salt Lake ($1,578)
Cedar City ($1,175)
Utah Rates Since 2011
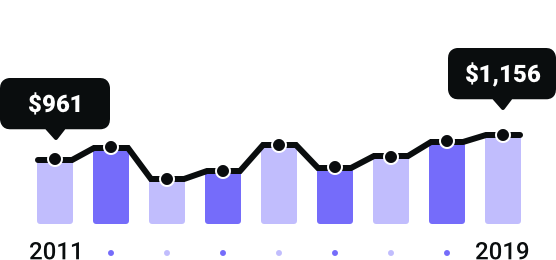
Vermont
$1,156
South Ryegate ($1,192)
New Haven ($1,107)
Vermont Rates Since 2011
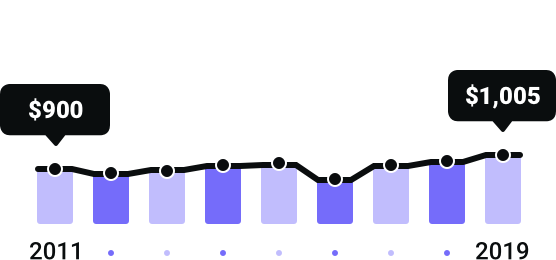
Virginia
$1,005
Bailey's Crossroads ($1,210)
Bridgewater ($835)
Virginia Rates Since 2011
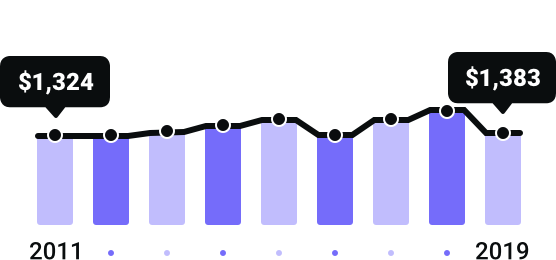
Washington, DC
$1,383
District of Columbia Rates Since 2011
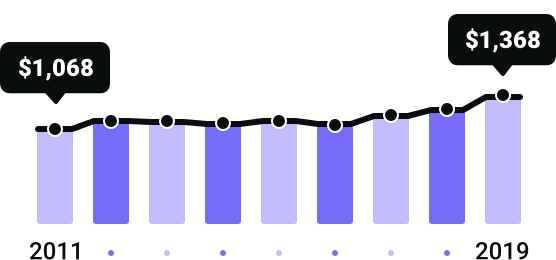
Washington
$1,368
Midland ($1,770)
Port Townsend ($1,145)
Washington Rates Since 2011
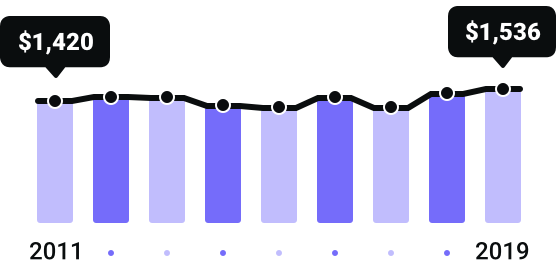
West Virginia
$1,536
Gilbert ($1,981)
Springfield ($1,297)
West Virginia Rates Since 2011
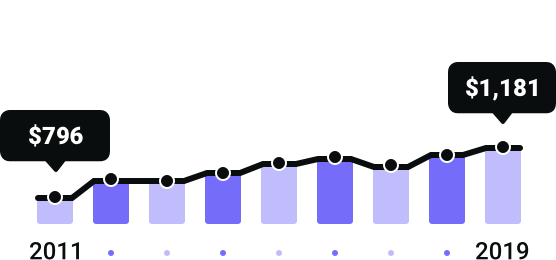
Wisconsin
$1,181
Brill ($1,765)
Neenah ($952)
Wisconsin Rates Since 2011
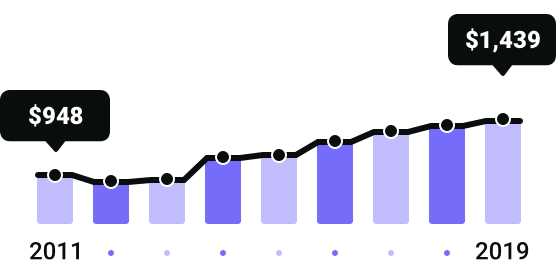
Wyoming
$1,439
Weston ($1,508)
Hanna ($1,382)
Wyoming Rates Since 2011
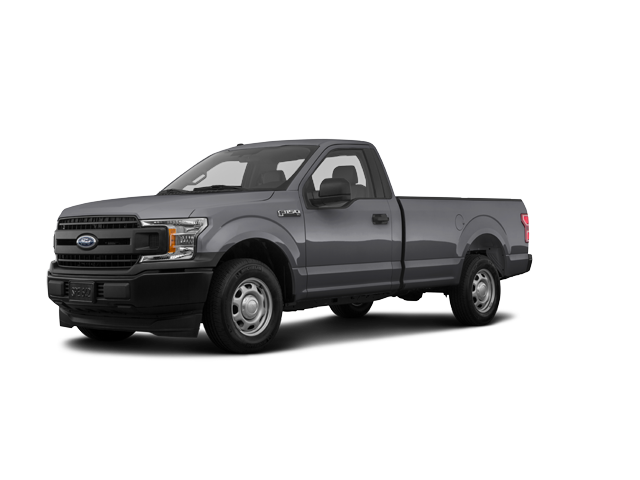
What does it cost to insure the 10 best-selling vehicles in America?
#1
Ford F-Series
$1,617/yr (5.7% of MSRP)
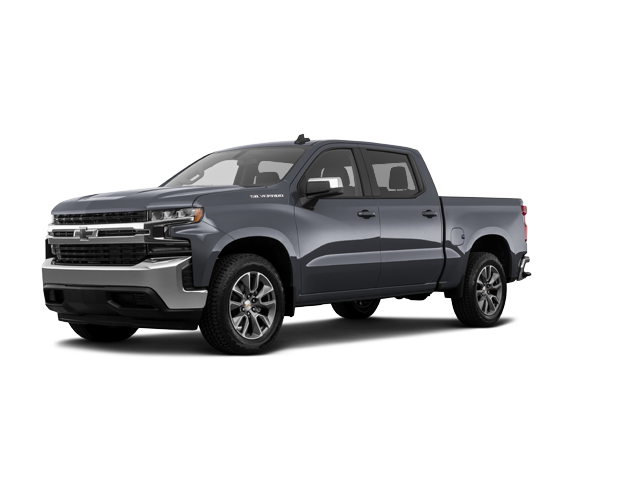
#2
Chevrolet Silverado
$1,741/yr (6.1% of MSRP)
#3
Ram Pickup
$1,879/yr (5.9% of MSRP)
#4
Toyota Rav4
$1,633/yr (6.4% of MSRP)
#5
Nissan Rogue
$1,638/yr (6.5% of MSRP)
#6
Honda CR-V
$1,529/yr (6.3% of MSRP)
#7
Toyota Camry
$1,800/yr (7.5% of MSRP)
#8
Chevrolet Equinox
$1,625/yr (6.8% of MSRP)
#9
Honda Civic
$1,814/yr (9.2% of MSRP)
#10
Toyota Corolla
$1,788/yr (9.6% of MSRP)
*Using 2019 models for the most popular vehicles in the U.S. by annual sales. See full report for more vehicle rates.
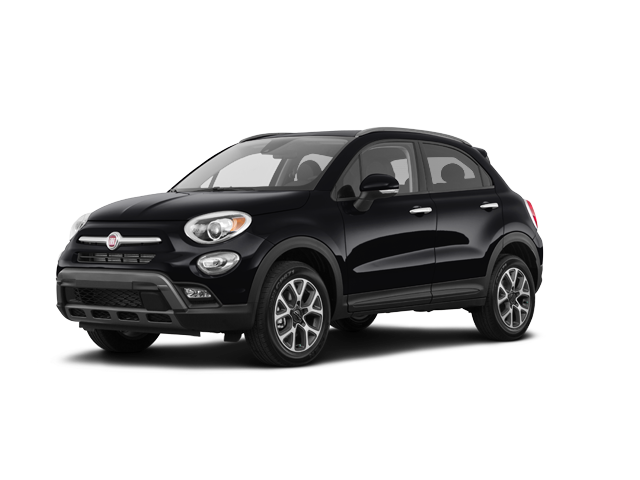
Least expensive
Least expensive
Fiat 500X
$1,467 (5.9% of MSRP)
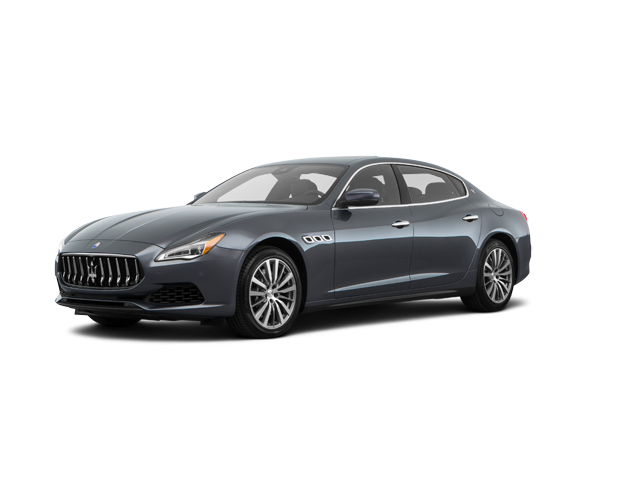
Most expensive
Most expensive
Maserati Quattroporte
$4,742 (4.4% of MSRP)
How much will a ticket or accident increase your insurance rate?
DUI
At-fault collision
Speeding
Running a red light
Texting while driving
Not wearing a seatbelt
2019
2020
Did you know?
Most driving violations affect rates for three years, but some last even longer. Drivers pay these insurance penalties in addition to fines and court costs.
Did you know your rideshare driving affects your car insurance?
Men and women pay different rates for car insurance in most states, and nationally, women pay about 1% more than men. Women in Louisiana pay the biggest difference compared to men (5% more), while men in Wyoming pay the biggest difference compared to women (3.7%).
Getting married can save you up to 12.7% on car insurance in some states, though national savings average 6%.
Drivers save on average 1.5% by earning a high school diploma or GED, 3% for a bachelor’s degree, and 3.5% for a Masters or Ph.D.
Nationally, renters pay 2% more for car insurance than homeowners or condo owners (or up to 7% more in some states).
In some states, your career can impact your car insurance rate. Professionals with advanced degrees, such as doctors, engineers, and lawyers, pay 2% less on average compared to civil servants or people who are unemployed.
Credit has a substantial impact on auto insurance rates in almost every state. Improving your credit one tier can save an average of 17%, while drivers who improve from fair to excellent credit can cut their car insurance rate in half.
Drivers in their 50s and 60s pay the lowest premiums while teens pay the highest premiums. In fact, adding a teen driver to their policy doubles a parent’s car insurance rates.
If you drive for a rideshare company like Uber or Lyft, you need special coverage added to your policy. This adds about 15% to your car insurance rate.
*Certain states do not factor non-driving information such as credit score, level of education, and whether drivers rent or own their homes into insurance rates. See full report for more.
Pro Tips: How can you save on car insurance?
Save 17%
Increase your credit score by one tier
Save 18%
Buy a used car (a 5-year-old model saves about 3.4% each year)
Save 13%
Raise your deductible from $500 to $1000
Save 12%
Purchase your policy in advance; pay in full and online
Save 8%
Bundle your auto policy with home, condo, or renters insurance
Save 8%
Maintain continuous coverage for at least 6 months
About the report
The Zebra is the nation's leading insurance comparison site and an independent source for insurance quotes, industry research, and educational resources for consumers.
9Years
418Insurance companies
34,000U.S. ZIP codes
73 millionCar insurance rates
The Zebra’s 2020 State of Auto Insurance Report analyzes more than 73 million car insurance rates to examine the latest trends, how dozens of risk factors affect car insurance pricing, and where drivers are impacted the most.
Car insurance is a safeguard that protects you in the event of an accident, theft, or unexpected disaster. But this protection comes at a cost, and it’s different for everyone. Insurance companies determine your individual rate based on a variety of factors, including what kind of car you drive, how you drive, and who you are (your age, marital status, even your credit score).
Rates also vary from one insurance company to another, from year to year, and from one town to the next. This research explores rates from 418 insurance companies, over the past nine years, and across 34,000 U.S. ZIP codes to identify trends and critical factors impacting rates in 2020.
Inside the data
9Years
418Insurance companies
34,000U.S. ZIP codes
73 millionCar insurance rates
Methodology
The Zebra’s 2020 State of Auto Insurance Report reflects an analysis of more than 73 million unique auto insurance rates from The Zebra’s proprietary quote engine. The Zebra research team explored auto insurance pricing data from 2011 to 2019 across all United States ZIP codes using a base driver profile representative for the average insured: a 30-year-old single male driver with a 2015 Honda Accord EX. For more details on methodology, download The Zebra’s 2020 State of Auto Insurance Report.
Using the Data
The Zebra is the nation’s leading, independent insurance comparison site with the goal of making auto insurance easier to understand. We encourage you to explore, share, and reference the findings of our report, with attribution to “The Zebra” or “TheZebra.com” and link to this page. Download The Zebra logo and brand assets.
Interested in learning more?
For specific data requests or more information, contact the report authors.