11 Angriest Cities in the U.S.

New Orleans tops our list

Author profile picture

Susan Meyer

Senior Editorial Manager

Susan is a licensed insurance agent and has worked as a writer and editor for over 10 years across a number of industries. She has worked at The Zebr…

Credentials
  • Licensed Insurance Agent — Property and Casualty
Author profile picture

Beth Swanson

SEO Content Strategist

Beth joined The Zebra in 2022 as an Associate Content Strategist. She is a licensed insurance agent whose goal is to make insurance content easy to r…

Credentials
  • Licensed Insurance Agent — Property and Casualty
  • Associate in Insurance


The data behind America’s angriest cities


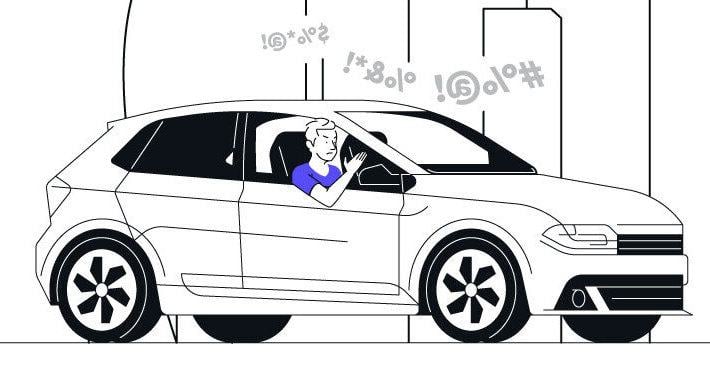
When you think of how anger shows up in communities, you probably picture scenarios like aggressive driving and violent crime. In some cities, these metrics (and others) are much more noticeable, whether it's due to greater stress levels, rush hour traffic, or other factors. 

Using data based on four different metrics, we ranked the angriest cities in America, where frustrations overflow more frequently than others. Here's what we looked at across the country's 50 most populous cities: 

  • Hours spent in rush hour each year: More time spent in traffic can quickly lead to hotter tempers.
  • Wellbeing Index score: This Gallup poll looks at career, social, financial, community, and physical elements. 
  • Aggravated assault crime rate: We gathered the number of aggravated assault cases per 100,000 residents.
  • Road rage: This is the percentage of accidents in each state caused by aggressive or careless driving.

Which cities earned the reputation for being angrier than others? Here's a roundup of the top 11 locations across the country.

#1: New Orleans, Louisiana

Mardi Gras vibes may not last year-round in New Orleans, which ranks as the angriest city in the U.S. Residents spend an average of 49 hours in rush hour traffic each year and also have the second-lowest score on the Wellbeing Index. New Orleans also ranks in the top five when it comes to both aggravated assaults and road rage-related car accidents.

  • Yearly hours spent in rush hour: 49
  • Wellbeing Index score: 58.9
  • Aggravated assault rate (per 100k residents): 90.06
  • Accidents caused by aggressive driving (state): 62%

#2: Baltimore, Maryland

Baltimore takes the second spot on our list, largely due to its high assault rate and lower Wellbeing Index score. Time spent in rush hour is just above our list's average mark, clocking in at 42 hours per year. 46% of accidents in Maryland are caused by aggressive or careless driving, which ranks 14th overall.

  • Yearly hours spent in rush hour: 42
  • Wellbeing Index score: 60.4
  • Aggravated assault rate: 64.05
  • Accidents caused by aggressive driving (state): 46%

#3: Milwaukee, Wisconsin

Milwaukee residents don't spend nearly as much time in traffic as people in other cities, but tensions are still high on the road. Over half of all accidents in the state involve aggressive driving and Milwaukee's aggravated assault rate is one of the highest reported in the country at 71.24 per 100,000 residents.

  • Yearly ours spent in rush hour: 29
  • Wellbeing Index score: 60.9
  • Aggravated assault rate: 71.24
  • Accidents caused by aggressive driving (state): 56%

#4: Indianapolis, Indiana

Indianapolis shares a similar anger profile with Milwaukee. Residents spend about 29 extra hours commuting during rush hour and the city's Wellbeing Index score is just over 60. Road rage, however, is a little more muted; only 43% of accidents involve aggressive driving in Indiana, and the assault rate in Indianapolis is just over 52.

  • Yearly hours spent in rush hour: 29
  • Wellbeing Index score: 60.3
  • Aggravated assault rate: 52.19
  • Accidents caused by aggressive driving: 43%

#5: Cleveland, Ohio

Ohio takes the top spot for the number of accidents caused by aggressive driving, which sits at 64%. Violent crime is also above average in Cleveland, with an aggravated assault rate of 72.32 per 100,000 people. The good news is that drivers won't have to spend too much extra time on the road; rush hour is one of the shortest in the nation at 17 hours per year.

  • Yearly hours spent in rush hour: 17
  • Wellbeing Index score: 60.5
  • Aggravated assault rate: 72.32
  • Accidents caused by aggressive driving (state): 64%

#6: Tampa, Florida

Despite its sunny beaches, Tampa ranks sixth on our list of angriest cities. Residents spend an extra 40 hours per year stuck in rush hour traffic. That frustration may contribute to Florida's high aggressive driving rate, which accounts for 48% of accidents. Tampa's Wellbeing Index is just a little higher than others on our list, but the aggravated assault rate is quite low at 25.78.

  • Yearly hours spent in rush hour: 49
  • Wellbeing Index score: 60.7
  • Aggravated assault rate: 25.78
  • Accidents caused by aggressive driving (state): 48%

#7: Atlanta, Georgia

Atlanta's Southern charm doesn't always appear, especially on the road. With an extra 48 hours spent in rush hour traffic, 43% of Georgia's accidents are caused by aggressive or careless driving. The city does rank well in terms of its Wellbeing Index score, but violent crime is an issue, with an assault rate of 41.78.

  • Yearly hours spent in rush hour: 48
  • Wellbeing Index score: 61.6
  • Aggravated assault rate: 41.78
  • Accidents caused by aggressive driving (state): 43%

#8: Philadelphia, Pennsylvania

Philadelphia commuters spend 44 hours a year stuck in rush hour traffic, but that doesn't translate into too much road rage. Only 34% of accidents in Pennsylvania are caused by aggressive driving, which is the lowest on our list of angriest cities. However, aggravated assault cases are above average at 43.2 per 100,000 people and the city's Wellbeing Index is just 60.7.

  • Yearly hours spent in rush hour: 44
  • Wellbeing Index score: 60.7
  • Aggravated assault rate: 43.2
  • Accidents caused by aggressive driving (state): 34%

#9: Cincinnati, Ohio (tied)

Cincinnati is the first of three cities that tied for ninth place. A whopping 64% of accidents in Ohio are caused by aggressive or careless driving, despite only 21 hours spent in rush hour traffic each year in Cincinnati. The aggravated assault rate is quite low at just under 34, but the city's Wellbeing Index only scores 60.5.

  • Yearly hours spent in rush hour: 21
  • Wellbeing Index score: 60.5
  • Aggravated assault rate: 33.93
  • Accidents caused by aggressive driving (state): 64%

#9: Detroit, Michigan (tied)

Detroit takes our next spot for ninth place, largely due to having the second-highest aggravated assault rate. Careless or aggressive driving only accounts for 36% of accidents, and rush hour adds just an extra 20 hours to residents' commutes yearly. However, Detroit's Wellbeing Index score is on the lower end compared to other cities we analyzed.

  • Yearly hours spent in rush hour: 20
  • Wellbeing Index score: 60.3
  • Aggravated assault rate: 103.82
  • Accidents caused by aggressive driving (state): 36%

#9: New York, New York (tied)

New Yorkers may seem to always be in a hurry, but that may be because the city has the longest rush hour commute, which adds up to a staggering 94 hours each year. New York City's Wellbeing Index score is average compared to others on our list, and the state's aggressive driving accidents only account for 37% of all incidents. The aggravated assault rate in New York is also middle of the road at just over 31 cases per 100,000 people.

  • Yearly hours spent in rush hour: 94
  • Wellbeing Index score: 61.5
  • Aggravated assault rate: 31.22
  • Accidents caused by aggressive driving (state): 37%

Methodology

The Zebra pulled four data points to analyze the top 50 MSAs (by population) in the U.S. related to anger.

  • Hours spent in rush hour each year[1]
  • Wellbeing Index score[2]
  • Aggravated assault rate[3]
  • Percentage of accidents caused by aggressive or careless driving[4]

MSA data was used where applicable, and we sometimes substituted city or state data as necessary.

Sources
  1. Traffic index ranking. [TomTom Index]

  2. Well-Being Index. [Gallup]

  3. Aggravated assault rate. [FBI]

  4. States with the most road rage. [H&P Law]