

Key insights + statistics
- Distracted driving killed 3,308 people in 2022 (NHTSA)
- In 2022, distracted driving broke its seasonal patterns of high in the summer and low in the winter, becoming a constant throughout the entire year. (Cambridge Mobile Telematics)
- Drivers were 30% more distracted in February 2022 than they were in February 2020, making it the worst month for phone distraction in the U.S. since 2019. (Cambridge Mobile Telematics)
- Speeding is still above pre-pandemic levels, but it's well below the highs of 2020. (Cambridge Mobile Telematics)
- Distracted driving spikes at night between 6:00 pm and 11:00 pm. (Cambridge Mobile Telematics)
- In 2020, distracted driving was a reported factor in 8.1% of fatal motor vehicle crashes. (NHTSA)
- 42% of high school students across the United States admitted that they text or email while driving. (TeenDriversSource)
- Roughly 20% of injuries occurring in car accident crashes involve distracted driving. (NHTSA)
- Distracted driving accounted for 27% of all crashes in 2015. (ENDDD)
- Drivers are distracted by their phones at least 10% of their driving time. (NHTSA)
- 48 states have bans on texting while driving. (IIHS)
What is distracted driving?
The exact definition of distracted driving is fairly straightforward: if you engage in an activity that takes your eyes off the road, you are driving distracted. From drinking coffee to checking on the kids in the rearview mirror, distracted driving is all too common, but it is incredibly dangerous. Like texting and driving, this behavior results in loss of the mental focus required to drive safely — even if you look away momentarily. Car crashes due to distracted driving number in the thousands — as the data shows — and thousands of lives are lost each year despite the fact that this negligence is entirely preventable.
Using national data from the National Highway Safety Association, the Center for Disease Control, and the American Automobile Association, and other publically available resources, the true impact of this reckless behavior on American roads will be determined. Along with The Zebra's own proprietary data, we can better determine how we can better prevent distracted driving.
Table of contents
- Distracted driving data from 2024 national survey
- Distracted driving data from a 2021 national survey
- Distracted driving data from a 2020 national survey
- Distracted driving data from a 2019 national survey
- Government data and publicly available resources on distracted driving
- Texting while driving laws in all 50 states
- Distracted driving statistics by state
- Comparing distracted driving and drunk driving
- How many people die from distracted driving each year?
- Distracted driving violations and your car insurance
- FAQs about distracted driving
Distracted driving statistics 2024
In March of 2024, The Zebra conducted a survey of American drivers to understand the habits they engage in behind the wheel of a car. While many claim they never drive while distracted, others admit to engaging in many other behaviors while driving, including texting while driving.
- 60.2% of respondents reported talking on the phone while driving. Other behaviors include:
- Sending or receiving a text message while driving (47%)
- Using an app on their phone (40%)
- Adjusting a GPS device (59%)
- Eating or drinking (59%)
- Applying makeup (11%)
- Taking a photo or video (22%)
Our survey also looked into how many Americans view distracted driving, either as dangerous or not. When asked if they consider texting and driving to be more or less dangerous than drinking and driving:
- 71% of the general population said they thought both were equally dangerous.
- There was some variation by age. Younger generations were more likely to say that drinking and driving was more dangerous (30% of Gen Z for example versus only 10% of Boomers).
Distracted driving statistics 2021
In January of 2021, The Zebra reached out to American drivers to understand the habits they engage in behind the wheel of a car. While many claim they never drive while distracted, others admit to engaging in many other behaviors while driving, including texting while driving.
- 52.5% of respondents reporting eating while driving, down 4.2% from last year's respondents. Other behaviors include:
- Texting (23.6%)
- Taking photos (11.7%)
- Applying makeup (6.5%)
- 3.4% admitted to drinking while driving!
Our survey also looked into how many Americans view distracted driving, either as dangerous or not.
- 36.4% of participants completely agree that using a mobile device hinders your ability to drive, yet 36% admit to engaging in activities with a cellphone while driving.
- Less than half of participants completely agree that texting and driving is just as dangerous as drinking and driving, despite numerous studies proving both activities limit your capacity for awareness and focus.
- Only 4.1% of participants ages 25-34 claimed they felt a high degree of pressure to respond to text messages while driving. In total, 12.1% of respondents in that age group felt any pressure to answer a text at all.
- 17.9% of the age group 18-24 felt the most pressure to respond to a text while driving. Interestingly, it is also this age group that is most often in accidents.
A look at the comparison between Android and Apple users reveals something interesting about the two OS users.
- 40.4% of Apple users admit engaging with their cellphone while driving, a 13.7% increase from last year's survey from The Zebra.
- 55.1% of Android users admit engaging with their cellphone while driving, a 2.7% decrease from last year's survey from The Zebra.
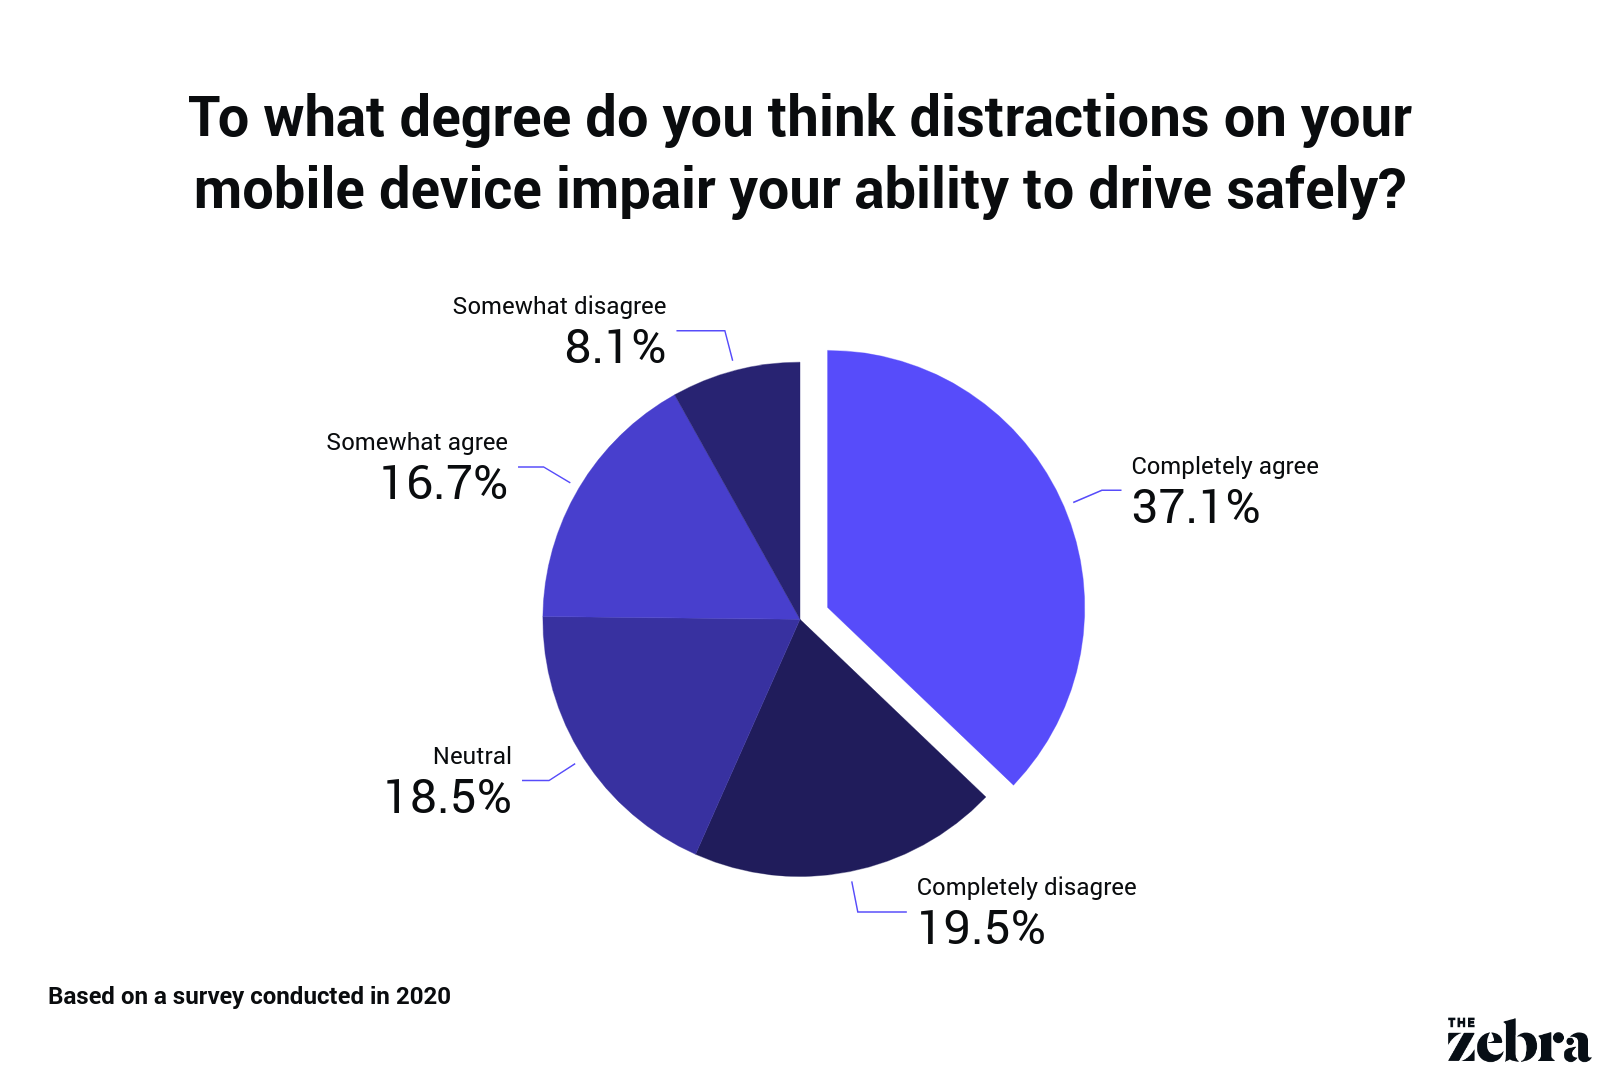
Distracted driving statistics 2020
In January 2020, The Zebra conducted a survey to observe the driving behaviors and attitudes of 2,000 Americans.
- 37.1% of respondents completely agree that distractions on your mobile device impair your ability to drive safely, yet 28.6% of all respondents admitted to texting and driving as their number one distracted driving behavior, over video-chatting, engaging with work emails, and taking photos or videos.
- 56.7% of all respondents reported that they eat or drink while driving.
- 8.9% of respondents aged 25 to 34 said they felt a high degree of pressure to respond to a text message as soon as it came in, and 7.3% of that same age group also felt a high degree of pressure to respond to work-related messages/emails while driving.
- Of those respondents who completely agree that texting and driving are equally as dangerous as drinking and driving, 39.9% said they have engaged with drinking alcohol while driving.
Following up on a survey conducted in 2019 by The Zebra, we analyzed the driving patterns of individuals categorized by their mobile device's operating system.
- 58.6% of respondents using Apple iOS said they felt a very high degree of pressure to respond to a text message, while only 17.7% of Google Android users felt the same.
- 70.4% of Apple iOS using-respondents admitted to video-chatting while driving, while only 23.7% made the same choice.
- 53.7% of Android users in this survey completely agree texting and driving is equally dangerous as drinking and driving, while only 51.5% of iPhone users feel the same way.
2019 distracted driving statistics
In March 2019, The Zebra conducted a survey of the driving behaviors and attitudes of 2,000 Americans.
- 37% of respondents aged 18 to 34 said they felt a high degree of pressure to respond to work-related messages while driving, compared to 25% of the national average among all age groups.
- Parents with young children were more likely to be distracted while driving (87%) than were adults with no small children (74%).
- One in three female drivers admitted to taking photos while driving.
Our study also uncovered variations in distracted driving behavior based on the operating system of the cell phone the driver used.
- 16% of iPhone users said they never get distracted while driving (vs. 23% of Android users and 38% of users of other mobile operating systems).
- iPhone and Apple Carplay users are more than twice as likely as Android users to video-chat, use Instagram, stream shows on Netflix or Hulu, and take photos and videos while driving.
- 10% of iPhone users admitted watching videos on YouTube while driving, while 4% of Android users admitted to doing the same.

Distracted driving statistics prior to 2019 (2012-2018)
The following data comes from the National Highway Traffic Safety Administration, the National Safety Council & internal reporting from The Zebra.
The phrases “driving while texting” and “driving while distracted” may seem interchangeable, but “distracted driving” encompasses much more than checking your cell phone at a stoplight. Distracted driving has major ramifications related to traffic safety, driving violations, and corresponding impacts on insurance rates.
If you aren't giving your full attention to the road, the cars around you, and the speed limit, you are driving distracted. According to the National Highway Traffic Safety Administration, three types of distracted driving exist:
- Manual distraction: when a driver takes their hands off the wheel to adjust the radio, reach for an item, or pet their dog.
- Visual distraction: when a driver takes their eyes off the road to look at an accident, glance at a text message, or look at their kids in the back seat.
- Cognitive distraction: when a driver takes their mind off the act of driving to daydream, think about a problem at work, or consider their grocery list.
These distractions may seem fairly innocuous, but a lot can happen in an instant.
- According to the American Automobile Association (AAA), 31% of drivers are distracted by their dogs in the car. While 80% of people admitted to driving frequently with their pets, only 17% used a pet restraint, such as a seatbelt or kennel.
- A driver is eight times more likely to be involved in a crash when reaching for an object and three times more likely to crash while eating or drinking.
- Distracted driving — including texting while driving — is the cause of more than 58% of crashes involving teen drivers.
If these statistics are startling to you, distracted driving awareness month is every April. Consider using next April to learn more about this epidemic that's threatening safe driving habits.
Texting while driving and cellphone use laws by state
Ranking distracted driving habits by state
The following data comes from Quartz and Zendrive. Please refer to their websites for additional information regarding the data below.
Based on Zendrive's data from 4.5 million drivers, all 50 states and D.C. were ranked based on drivers' percentage of driving time spent using their phone. Mississippi had the highest percentage with 8%, while the lowest was 5.2% for Oregon. Here are the top nine states:
| State | Driving Time Spent Using Phone |
| Mississippi | 8.0% |
| Rhode Island | 7.7% |
| Louisiana | 7.7% |
| Oklahoma | 7.1% |
| Connecticut | 7.0% |
| Texas | 7.0% |
| Arkansas | 6.9% |
| Massachusetts | 6.9% |
| District of Columbia | 6.9% |
Distracted driving vs. drunk driving — which is more dangerous?
The Transport Research Laboratory found that "writing a text message slows driver reactions by 35% while drinking alcohol up to the legal limit slows reactions by 12%." Yet many Americans are still unconvinced that drunk driving is more dangerous than driving while distracted. But let's break down the undeniable facts:
- Loss of life
- Drunk driving claims 29 lives per day, more than 10,000 per year.
- Distracted driving claims 9 lives per day — approximately 3,500 per year.
- Economic impact
- Distracted driving costs society $40 billion a year.
- DUIs cost $44 billion per year.
- Violations by state
- Only 47 states have laws against distracted driving, while 16 have specific laws against texting and driving, implementing a texting ban.
- All 50 states have laws against drunk driving and law enforcement knows how to identify a drunk driver.
- Legal fines
- Drivers can receive a fine of up to $500 for a distracted driving offense.
- Drivers receive a fine of $1,500 for their first DUI.
Distracted driving fatality statistics
In 2024, the NHTSA has published their annual Motor Vehicle Crash report for 2022. Overall, the total average motor vehicle deaths went down from 2021 to 2022:
- 42,514 people were killed in motor vehicle traffic
crashes, a 1.7% decrease from 43,320 fatalities in 2021 with - 2.38 million people were injured on U.S roads in 2022, decreasing 4.6% from 2021.
- 5.93 million were in police-reported accidents in 2022, decreasing 2.8% from the previous year.
Additional NHTSA data states that there were 3,308 fatalities in distraction-affected crashes (a crash involving at least one driver who was distracted):
- Distraction-affected crashes represented 7.8% of total traffic fatalities in 2022
- This actually represents a 6% decrease in distraction-affected crashes from the previous year.
Distracted driving insurance ramifications
How does a ticket impact car insurance rates? In 2011, a distracted driving violation raised a driver’s car insurance rates by less than 16%, equating to less than $100 per year in extra premiums. In 2024, a cell phone violation can increase your insurance premiums by 21.56%.
From 2023 to 2024, the percent increase on your premium for a cellphone violation stayed about the same at close to 22%, the trend leveling out from its upward climb since 2011. But the penalty for distracted driving has increased notably in recent years as insurers learn more about the costs and more states create laws prohibiting it.
- While most states have passed anti-distracted driving laws to penalize drivers for distracted driving, these insurance rate penalties range from $87 in some states to $762 in others.
- Vermont's auto insurers apply the harshest insurance penalty for distracted driving, with a 56% premium increase (more than $600 per year).
- New York has the most lenient distracted driving penalty; a distracted driving violation increases insurance rates for New York state drivers by just 5%.
FAQs about distracted driving
What are the four types of distractions while driving?
The four types of distractions for drivers are:
- Visual: looking at something other than the road
- Auditory: hearing something not related to driving
- Manual: taking hands off the wheel
- Cognitive: thinking about something other than driving
What are the top 10 distractions while driving?
According to Toyota Arlington, the top ten distractions while driving are:
- Lost in thought
- Cell phone use
- Looking at something outside the car
- Someone in the car
- Using a device within the car, other than a phone
- Eating or drinking
- Adjusting the radio or A/C
- Using a vehicle function such as cruise control
- Moving objects
- Smoking
Why is distracted driving a problem?
Every type of distracted driving increases your risk of a car crash, injury, and even death. For example, reaching for an object increases a driver's risk of crashing by 800%.
What are the 3 main types of distracted driving?
The three main types of distracted driving are:
- Visual
- Cognitive
- Manual
Expensive rates due to a driving violation? Compare hundreds of quotes instantly!
Sources
- Cambridge Mobile Telematics
- Distracted Driving | NHTSA
- Distracted Driving | CDC
- Ending Distracted Driving is Everyone's Responsibility | NSC
- Distracted Driving | IIHS
- Digest of Motor Laws | AAA
- Facts + Statistics: Distracted Driving | III
- Texting Lifts Crash Risk | NYT
- Transport Research | RAC Foundation
Methodology
This study was conducted for The Zebra using SurveyMonkey. The sample consisted of 998 completed responses per question. Post-stratification weighting has been applied to ensure an accurate and reliable representation of the total population. This survey was conducted in March 2024.
Copyright © 2024 InsuranceZebra, Inc. All rights reserved. For inquiries regarding this content, please contact our team at press@thezebra.com.
Stay in touch and subscribe!
Get advice, insights and tips from our newsletter.