

Key insights + statistics
- The U.S homeownership rate stayed at around 64% since the 1960s (U.S Census Bureau)
- Black Americans are 40% less likely to own their homes than their white counterparts. (U.S Census Bureau)
- In 2019, the national homeownership rate for the first quarter of 2019 rose to 65.1%. (U.S Census Bureau)
- Nearly 75% of white households outright own their homes. (U.S Census Bureau)
- Over 67.9% of Americans were homeowners in 2020. (Housing Wire)
What percentage of homes are owner-occupied?
While much data is still being collected on the final numbers for homeownership in 2020, the national census identified that owner-occupied households were 60.6% of all household units. Despite 2020 crippling thousands of small businesses and overloading the healthcare system, it was a record year for home-buying.
Using the most recent public data and historical census records, The Zebra has sourced hundreds of data points to give a comprehensive look at homeownership in America.
Table of contents
- Homeownership statistics
- Housing market trends over the years
- Homeownership trends by age group
- Homeownership rates by ethnicities
- Homeownership rates by state
- Homeowners insurance: why you need it
- FAQs about homeownership
Homeownership rates (updated)
In late 2020, The Zebra surveyed 1,205 homeowners from all 50 states and Washington, D.C to discover what the experience of buying and owning a home has been like for them. For more details, see our full report on the American homebuying experience, the very definition of the American dream.
When it comes to advice around what to buy and when, our respondents felt most secure in advice from their partners:
Who did they rely on most for advice?
- 48% of the respondents chose their spouse/partner
- 45% of the respondents chose their real estate agent
- 40% of the respondents chose their parent(s)
- 22% of the respondents chose their friends
Who relied on their spouses for advice while home shopping?
| Women who relied on their partners for advice | Men who relied on their partners for advice | |
| Gen Z | 42.9% | 21.7% |
| Millennials | 59.4% | 41.2% |
| Gen X | 46.7% | 51.7% |
While buying a home is a big milestone, experienced homebuyers recognize that home maintenance is a never-ending process.
- 67% of first-time buyers say they've already taken steps to reduce risk to their home, like adding security lights or upgraded roofing.
- 55% of this same group have more than $1,000 in emergency savings to cover repairs or deductibles.
- 13% of new homeowners have less than $100 to cover these expenses.
As millennials continue to dominate the market as the lead first-time homebuyers, their priorities have changed from those of prior generations. More homeowners own pets than children.
- 81% of first-timers have at least one pet.
- 56% of first-timers have at least one child residing in their home.
- 7% of Boomers that participated in this survey wrote-in "fish" as the only pet they own.
Homeownership rates over the years
Several government agencies, such the U.S Census Bureau, and private companies supporting homeownership such as Freddie Mac and the National Association of Realtors have identified key data points about home affordability for most Americans.
- The current 30-year fixed interest rate, according to Freddie Mac, has been set at 2.77%. Freddie Mac surveys lenders weekly.
- According to the National Association of Realtors, the median price for existing single-family homes affordability increased 4.8% from 2017 to 2019.
- The U.S Census Bureau dictates from the housing vacancy survey, the rental vacancy rate sits at around 6.4% in 2020, a drop from 6.8% in the third quarter of 2019.
- 64% of Americans own real estate.
- 35% of the American population does not own their own homes.
- Homeownership rates have increased to nearly 65% in the US since the 1940s.
To add to this data, The Zebra did a deep analysis of the housing market and found some startling statistics:
- Homes have become less affordable: In 1960, approximately 68 out of 100 Americans could afford a home, but now only around 43 out of 100 can afford one.
- Homeownership disparity has increased slightly: In the last 60 years, the homeownership gap between white and Black Americans has widened slightly from 28% to 29.4%.
- In 2020, singles experienced the highest homeownership rate, from 6.4% to 23%.
- 40 million renters are currently at risk of eviction.
- 3 million homeowners will have delinquent mortgages in 2021.
- 43% of renters and 5% of homeowners are in serious danger of losing their homes.
Homeownership rates by age demographics
The Urban Institute is the trusted source for unbiased, authoritative insights that inform consequential choices about the well-being of people and places in the United States. They found particular data regarding the fluctuating ages of new and existing homeowners.
- 75% of boomers are homeowners.
- Of those buying a home for the first time, 25% claimed the hardest part of buying a home was finding the right one.
- Between 2010 and 2017, the rates for adults ages 20-34 and 35-64 dropped from 70% to 67%.
- In 2020, only 37.3% of homeowners were under age 35.
The Zebra conducted a survey to better understand the motivations and realities behind the American dream: buying a home.
- Millennials account for 3 of every 5 first-time buyers (59%).
- Most of our respondents own a house (94%) while 6% own a condo.
- Gen Z focused more on improving their location and being close to work and school than other age groups.
- Millennials were interested in financial security, improving life for their children, and getting more space.
- Boomers were most interested in financial security and taking advantage of affordable rates
- 57% of respondents felt pressured to buy a home.
Homeownership rates by ethnicities
The National Association of Real Estate Brokers, (NAREB), is a Real Estate Professional trade organization. Combined with data from the St. Louis Fed, Zillow, Redfin, and the Urban Institute, we found that:
- The United States saw 277,000 new Hispanic homeowners in 2019, now accounting for more than 51% of the growth in U.S. homeownership since 2009.
- In the first quarter of 2020, 44 percent of black families owned their home, compared with 73.7% of white families.
- The rate of homeownership for Black households rose from 41.6% in 1970 to a peak of 46.5% in 2007.
- The current 30-percentage-point gap between black and white homeownership is larger than it was in 1968, when housing discrimination was legal.
- Communities of color are disproportionately affected by issues of housing security, with Black and Latinx individuals making up 80% of those facing foreclosure.
Homeownership rates by state
The U.S Census Bureau, HousingWire, and Statistica estimate that:
- The heaviest populations of homeowners are in these four states:
- New York
- California
- Florida
- Texas
- New census bureau data reveals 55.2 percent of California households lived in residences they owned in the third quarter of 2018.
- 64.3% of Americans owned their home in 1969.
- With the most recent data from 2019, West Virginia has the highest rates of homeownership with 72.5%. New York has the lowest percentage of homeownership with 53.7%
Homeowners insurance: why you need it
Homeowners insurance premiums are dependent upon several things: where you live, cost of building materials, the square footage of your home, and even your credit score (though this is not a rating factor in California and Massachusetts).
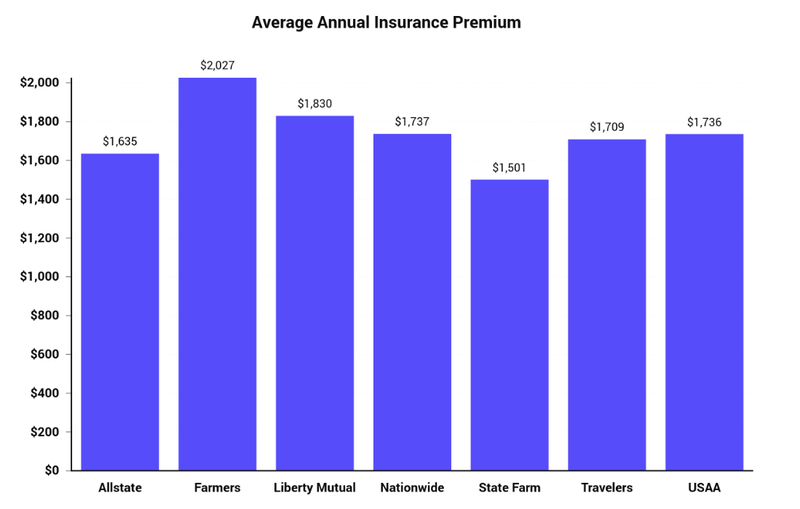
The Zebra analyzed thousands of rates to find the average premium of homeowners insurance in America. Here are the top seven most popular insurance carriers and their average homeowners insurance premiums:
| Insurance Provider | Average Annual Premium |
| Allstate | $1,635 |
| Farmers | $2,027 |
| Liberty Mutual | $1,830 |
| Nationwide | $1,737 |
| State Farm | $1,501 |
| Travelers | $1,709 |
| USAA | $1,736 |
Homeowners insurance premiums can vary depending on a number of factors, including where you live, cost of building materials, the square footage of your home, and even your credit score (though this is not a rating factor in California and Massachusetts).
The Zebra surveyed American homeowners to better understand their relationship with their homeowners insurance.
- Most first-timers (86%) have homeowners insurance.
- 36% said they additionally purchased flood insurance. This would be double the national average for flood insurance uptake (typically 15% according to the Insurance Information Institute).
Did they have prior experience with their home insurer?
- 70% of new homeowners bought their home insurance from the same company they had auto insurance with.
- 3 in 4 of them (73%) know someone else who has done business with their home insurer.
- Gen Z seems most influenced by their parents and family when it comes to insurance company choice.
Did they file any home insurance claims?
1 in 4 first-time homeowners with insurance said they had to file a claim. Here are some situations they ran into:
- "My television was damaged due to a thunderstorm."
- "Water leaked — floors had to be ripped up and replaced."
- "Damage caused by fire, when forgetting to turn off the gas stove."
- "Our backyard fence, because we live near the ocean and storm winds are very strong.
Frequently Asked Questions about home ownership
Q: What percentage of millennials are homeowners?
A: According to ApartmentList, 43% of millennial households own their homes.
Q: How is homeownership rate calculated?
A: According to the U.S Census Survey, the homeownership rate is computed by dividing the number of owner-occupied housing units by the number of occupied housing units or households.
Q: How many homeowners have paid off their mortgage?
A: 37% of U.S. households no longer have a home mortgage to pay, according to a Zillow data analysis.
Q: How many people rent in the US?
A: In 2019, more than 99.4 million United States residents were renters, HousingWire states.
Recently purchased a home? Compare homeowners insurance rates today!
Methodology
This study was conducted for The Zebra using Google Consumer Surveys. The sample consisted of no less than 1,000 completed responses per question. Post-stratification weighting has been applied to ensure an accurate and reliable representation of the total population. This survey was conducted in 2021.
Copyright © 2021 InsuranceZebra, Inc. All rights reserved. For inquiries regarding this content, please contact our team at statistics@thezebra.com.
Sources
Homeownership Rates Fall - PRB
Millenial Homeownership - Urban Institute
Hispanic Homeownership Rates - NAHREP
Housing Vacancies - US Census Bureau
Homwownership Rate in US - Statista
Homeownership in the US - Wikipedia
Stay in touch and subscribe!
Get advice, insights and tips from our newsletter.