The Growing Cost of Driving in 2026
State of Insurance™ | Auto
The Zebra’s latest report surveys 1,500 drivers and analyzes more than 32 million car insurance rates to get a clear picture of affordability in auto insurance in 2026

Susan is a licensed insurance agent and has worked as a writer and editor for over 10 years across a number of industries. She has worked at The Zebr…
 Credentials
- Licensed Insurance Agent — Property and Casualty

Beth joined The Zebra in 2022 as an Associate Content Strategist. A licensed insurance agent, she specializes in creating clear, accessible content t…
Credentials
- Licensed Insurance Agent — Property and Casualty
- Associate in Insurance (AINS)
- Professional Risk Consultant (PRC)
- Associate in Insurance Services (AIS)

Renata joined The Zebra in 2020 as a Customer Experience Agent. Since 2021, she has worked as a licensed insurance professional and content strategis…
Credentials
- Licensed Insurance Agent — Property and Casualty
- 5 years of experience in the insurance industry

Owning a Car Is Costing You More in 2026
After paying for a roof over your head, for many Americans, the next biggest line item in their budget is transportation. Americans spend around 17% of their annual expenses on transportation.[1] Which — given the U.S.’s large, public-transportation-scarce expanses — for the vast majority of Americans, means a car.[2]
When gas prices, car prices, and car insurance costs go up, the affordability of that transportation is in jeopardy. Unfortunately, in 2026 all three are up:
In light of all of these factors swirling, we surveyed American drivers to learn about their general financial and car insurance concerns. We learned where drivers are feeling the most pressure and what compromises they’re making in order to paint a clear picture of car insurance and vehicle affordability.
Financial Confidence Is Up. So Are Concerns About Everyday Costs
While only 31% of U.S. consumers rated current economic conditions in the United States good or very good, more than half (55%) saw their own financial state as good or very good. Additionally, two-thirds (62%) imagine their financial state will be good or very good next year.
Despite that confidence, consumers are still worried, with nearly two-thirds (63%) extremely or very concerned about inflation and rising prices. Additionally, nearly half (49%) are extremely or very worried about the cost of insurance.
Car Insurance Rates Are Stabilizing — But Not Everywhere
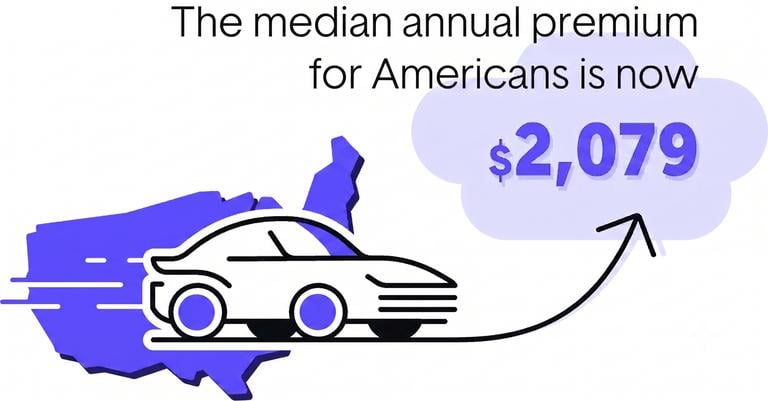
In 2026, the median cost to insure a vehicle is now $2,079 ($173 a month). That’s about the cost of the average 2-bedroom apartment in the U.S. or the average cost of two months of groceries for a family of four.[5]
That’s high. However, it’s not significantly higher than the median cost the year before ($2,016), which is welcome news after many years of steep increases.
David Seider, CCO of The Zebra and an experienced insurance leader, explains some of the reasons for this relief: “After years of bad loss ratios followed by premium hikes, we saw a couple years of outrageously good loss ratios. This has now led to a hyper-competitive environment amongst insurance companies. They are spending a ton on marketing and dropping rates to stay competitive. More or less: the auto industry over-shot its price correction in many geographies and rates are now stabilizing.”
That said, there are some big differences when we look at the individual states, due to each state having their own insurance laws and unique ratings factors:
- Louisiana has the highest median annual premium at $3,342, with Florida close behind at $3,334.
- Vermont, Wyoming, and North Carolina are the most affordable, all coming in under $1,400 a year.
- Just under half of states have median annual car insurance costs under $2,000.
Updating data...
Source: The Zebra

Where Rates Rose, Fell, and Barely Moved in 2026
The price of car insurance by itself is one thing, but if you’ve lived in your state for a while, the bigger thing you’ll notice is how much car insurance is increasing or decreasing.
In a world where everything feels like it’s getting more expensive, some states experienced a decrease in their car insurance premiums this year. This can happen when insurers' profit margins recover from previous inflationary spikes or when states change their insurance laws.
- 11 states saw a decrease from 2025 to 2026, with the largest decrease happening in Florida (where some residents even saw refunds this year).
- Most states saw only minor increases — under $100 — from 2025 to 2026.
- The highest annual increase was in New Jersey where insurance costs jumped from $2,423 to $2,676, costing New Jersey drivers $253 more than in 2025.
Why Are Rates Rising in Some Places More Than Others?
There are many macroeconomic factors at play that affect insurance nationally, such as tariffs, inflation, repair costs, and supply chain issues for auto parts. However, the significant differences in cost by state speak to a key aspect of insurance: it’s a state-regulated industry.
Each state has their own requirements and minimums, and each state approves how much insurance companies can charge. When it’s been a while since rate hikes are approved, it can lead to sudden jumps in costs, which is what’s happening in New Jersey, for example. Meanwhile, Louisiana is facing bodily injury claims at three times the national rate due to high rates of litigation, which contributes to premiums staying high.[6]
Seider adds: “There have been lots of state-by-state decreases for carriers this year. I expect to see some states have meaningful premium drops on a per-carrier basis. Take Florida, which went from being a no-go area to being one of the highest business-development priorities for carriers. Some of that is due to Florida's tort reform and some is because we had a quiet hurricane season last year.”
It’s Not What You Pay. It’s What It Costs You
Insurance costs don’t exist in a vacuum. They are a requirement in most states and thus an immovable line item within a larger budget.
In areas with a higher cost of living, we expect all costs for housing, food, and transportation to be higher. However, when it comes to insurance, that isn’t always the case. Some lower-cost-of-living states experience higher rates for car insurance.
That’s why we also consider the affordability of car insurance and how it compares to the median income for a state through The Zebra Premium Price Index (ZPPI). That way we can start to understand not only the dollar amount car insurance represents but the bite it takes out of residents’ budgets.
The higher the percentage, the less affordable insurance is.
- Americans pay around 2.69% of their incomes to car insurance.[7]
- Louisianans will pay more than 5% of their average annual income to car insurance costs.
- Wyoming residents see the most affordability when it comes to auto insurance, paying 1.47%.
In 27 States, a DUI Costs Less Than Having a Poor Credit Score
Another double-edged sword when it comes to car insurance is credit score. Lower income individuals are more likely to have lower credit scores, but they will also see higher insurance rates because of it.
Consumers with poor credit scores (below 580) pay a median of $1,805 more each year than consumers with excellent credit scores. This is comparable to the median annual premium for consumers with a DUI.
In addition to this being true nationally, it’s also true in 27 states. It’s worth noting that in California, Hawaii, Maryland, Massachusetts, Michigan, Oregon, and Utah, credit scores cannot legally be used to determine insurance rates.
In our survey, drivers with low credit scores reported being hit harder by rising prices than even drivers from lower income brackets. Only 38% of drivers with credit scores below 670 (poor or fair credit) said that the total cost of owning, insuring, and driving their vehicle(s) is affordable, compared to 53% of all drivers surveyed. This makes sense, given their insurance premiums could be as much as double what someone with excellent credit would pay.
These drivers are already being hit hardest by rising costs. Those with credit scores under 670 (poor or fair credit) have it the hardest of all, with (67%) choosing to cut back on driving to cut costs (compared to 57% of other consumers) and 68% saying the cost of fuel has caused them to cut back on other expenses (compared to 54% of other consumers).
There could be relief in sight for drivers with low credit scores in certain states. Iowa, New Jersey, New York, Oklahoma, and Pennsylvania all have active bills related to doing away with some non-driving rating factors.
How People Are Reacting to Economic Uncertainty on the Road
Understandably, in light of the current costs, people across generations are changing their behavior based on their economic concerns.
They’re taking on greater risks:
When asked how they would react to a 10% jump in their car insurance costs, 45% of consumers reported that they would reduce coverage or increase their deductible. More than a quarter of drivers (29%) would consider canceling or suspending their auto coverage entirely. This will only exacerbate the crisis of uninsured and underinsured motorists on the road.
Gen Z and millennial consumers are feeling particularly squeezed by insurance costs. More than half (53%) say their personal financial situation has significantly influenced their insurance spending, compared to just 38% of other consumers. And 48% of Gen Z say they would cancel their insurance altogether if it went up by 10%!
They're driving less:
Rising fuel costs are also impacting driver behavior. And in many cases, driving them right off the road.
Of drivers surveyed, 61% reported being extremely or very concerned about the increasing costs of fuel. Additionally, 57% reported driving less often to save money on fuel.
They're holding onto their cars for longer:
As mentioned above, the cost to buy a new car is now around $50,000. The average cost to buy a used car is also over $26,000.[8]
Our data shows that for many that may be out of reach. In fact, 64% of drivers surveyed say they plan to drive their current vehicle until it becomes too expensive or too difficult to repair in order to save money. It’s no surprise then that the average age of vehicle in the U.S. is rising to a current all-time high of 12.8 years old.[9]
How Drivers Can Help Manage Their Insurance and Car Ownership Costs
Owning a car in 2026 is expensive. There’s no getting around that. But there are some ways to help make your insurance more affordable or avoid more expensive issues later.

46% of consumers plan to shop for auto insurance in the coming year. Shopping for insurance is recommended every 6 months. Use an insurance comparison engine like The Zebra to compare quotes from hundreds of insurance companies to make sure you’re getting the best rate for your coverage.

Insurance doesn’t cover wear and tear and maintenance issues. At a time when many are feeling cash strapped, it can be tempting to put off routine maintenance and repairs. However, when you do, little problems can become big problems — which could ultimately cost you even more.

Every time you file a claim, it will make your insurance rates go up, even if you’re not at fault. Get a minor scratch in a grocery store parking lot? Often it makes more sense to price it out to fix it yourself and save your insurance for the big stuff. This is particularly true if you have a high deductible.

You’ll sometimes see the advice to raise your deductible for lower monthly payments. However, make sure you can actually afford to pay your deductible in the event you need to file a claim. 25% of people we surveyed said they couldn’t afford to pay their deductible (and that number jumps to 49% for people with fair or poor credit), which means their insurance isn’t really offering them the peace of mind it should be.
Nobody Does Insurance Like The Zebra ®
Since The Zebra’s first State of InsuranceTM report in 2016, car insurance prices have risen by about 74.6%. Back in 2016, Beyoncé was making Lemonade and we were still strangers to a brand-new show called Stranger Things. How things have changed since then!
Our unique analysis can’t be found anywhere else because no one else has access to both market data and the proprietary data we've gathered from years in the business. When it comes to the State of InsuranceTM, the trends we predict come not only from measured reports, but also from what we’ve seen from helping over 74 million people with their insurance since 2012.
Methodology
Survey:
The Zebra partnered with Savanta, an independent agency, to conduct an original survey which is based on online responses from 1,500 US auto owners that was conducted in April 2026. The data from 1,500 consumers has been weighted to the most recent Census to ensure it is representative of US consumers who own vehicles.
We break down credit scores by the following tiers: excellent (800+), very good (740-799), good (670-739), fair (580-669), poor (below 580).
We define generations by the following breakdowns: Generation Z (1997–2008), Millennials (1983–1996), Generation X (1966–1982), Baby Boomers (1947–1965), and Matures (1946 and earlier).
We use the following breakdowns for income brackets: less than $74,999, $75k - $149,999, $150k and more.
Database:
The auto insurance rates shown in this report are generated by The Zebra’s Dynamic Insurance Rating Tool, a proprietary estimator that uses the most up-to-date approved rate filings across the United States at the ZIP code level to ensure the data reflects current pricing. The underlying rate information is sourced from Quadrant Information Services, which compiles filings from insurers in every state using data from S&P Global.
This report has moved to using median numbers rather than averages in order to prevent extreme outliers from skewing the data.
We use the following base profile to calculate rates:
- A 30-year-old single male with good credit and no accident or violation history.
- A 2015 Honda Accord with 50/100/50 liability limits plus $500 deductibles for comprehensive and collision coverage.
When referencing The Zebra's research or proprietary rate data in editorial coverage, please attribute as: [Finding]. Source: The Zebra, State of Insurance™ | Auto: The Growing Cost of Driving in 2026 (July 2026). A link to the original report is appreciated. For questions about data methodology or press inquiries, contact press@thezebra.com.
-
What Do Americans Spend the Most on Each Year? [Qualtrics]
What Do Americans Spend the Most on Each Year? [Qualtrics]
-
1 in 10 Americans rarely or never drive a car. [Pew Research Center]
1 in 10 Americans rarely or never drive a car. [Pew Research Center]
-
Weekly U.S. Gasoline Prices. [U.S. Energy Information Administration]
Weekly U.S. Gasoline Prices. [U.S. Energy Information Administration]
-
Kelley Blue Book Report: New-Vehicle Price Increases Moderate in May, Incentive Spending Grows. [Kelley Blue Book]
Kelley Blue Book Report: New-Vehicle Price Increases Moderate in May, Incentive Spending Grows. [Kelley Blue Book]
-
Rent Trends in the United States. [Apartments.com]
Rent Trends in the United States. [Apartments.com]
-
LDI Review of NAIC Data Shows Frequent Bodily Injury Claims and Excessive Litigation Drive High Auto Rates in Louisiana. [Louisiana Department of Insurance]
LDI Review of NAIC Data Shows Frequent Bodily Injury Claims and Excessive Litigation Drive High Auto Rates in Louisiana. [Louisiana Department of Insurance]
-
To calculate affordability, this data is compared to average individual income data from the Federal Reserve Bank and US Bureau of Economic Analysis.
To calculate affordability, this data is compared to average individual income data from the Federal Reserve Bank and US Bureau of Economic Analysis.
-
Is Now the Time to Buy, Sell, or Trade in a Car? [Kelley Blue Book]
Is Now the Time to Buy, Sell, or Trade in a Car? [Kelley Blue Book]
-
Average Age of Automobiles and Trucks in Operation in the United States. [Bureau of Transportation Statistics]
Average Age of Automobiles and Trucks in Operation in the United States. [Bureau of Transportation Statistics]