Flood Insurance Gaps and Outdated Flood Maps: Are the Maps Still Accurate?

Author profile picture
Bob Phillips
Personal Finance Writer

Bob Phillips is a personal finance writer whose expertise in insurance and investments has been developed through over fifteen years as an advisor/tr…

Author profile picture
Susan Meyer
Senior Editorial Manager

Susan is a licensed insurance agent and has worked as a writer and editor for over 10 years across a number of industries. She has worked at The Zebr…

Credentials
  • Licensed Insurance Agent — Property and Casualty
Author profile picture
Beth Swanson
Insurance Analyst

Beth joined The Zebra in 2022 as an Associate Content Strategist. A licensed insurance agent, she specializes in creating clear, accessible content t…

Credentials
  • Licensed Insurance Agent — Property and Casualty
  • Associate in Insurance (AINS)
  • Professional Risk Consultant (PRC)
  • Associate in Insurance Services (AIS)
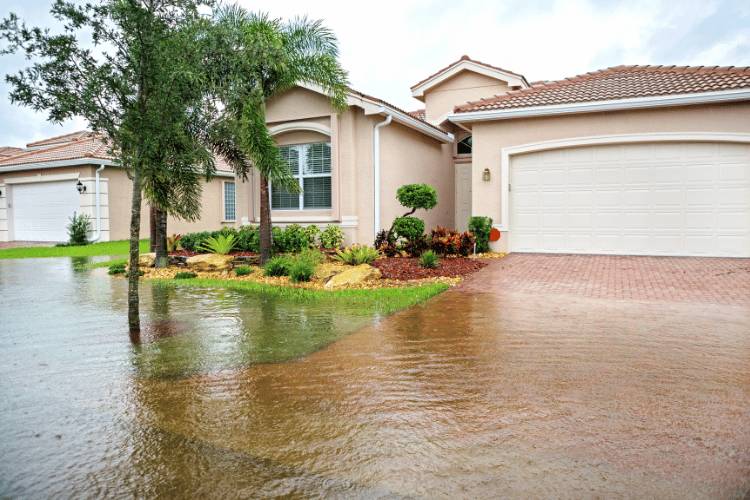
flood neighborhood (1)

The Assumption That's Leaving Homeowners Exposed

Most homeowners find out whether they need flood insurance one way: they check a map. If a property is located within FEMA's Special Flood Hazard Area, a mortgage lender usually requires flood insurance. If it doesn't, most people assume they're safe and skip it.

That assumption is increasingly wrong. Flood maps were built to show where rivers and coastlines have flooded in the past. They weren't built to show where climate change is pushing flood risk today.

The gap between the map and reality is leaving millions of homeowners exposed.

How Flood Maps Actually Work

FEMA's Flood Insurance Rate Maps are the backbone of the National Flood Insurance Program (NFIP). They designate high-risk zones, moderate-risk zones, and everything in between. They also determine who's required to carry flood coverage as a condition of a federally backed mortgage.

The maps are built mainly around two kinds of flooding: rivers overflowing their banks and storm surge along the coast. They're also backward-looking. They model risk based on historical flood events and existing land conditions, not on where rainfall patterns or sea levels are headed over the next 10 or 30 years.

That approach made more sense decades ago, when flood patterns were relatively stable. It's a poor fit for a climate that's delivering heavier rainfall, faster-intensifying storms, and flooding in places with no recent history of it.

The Gap Between FEMA's Maps and Actual Risk

FEMA itself has acknowledged the shortfall. The agency's own leadership has said the maps focus on riverine and coastal flooding.[1] They don't account well for the intense rainfall events becoming more common across the country.

Independent modeling backs that up. First Street Foundation, a nonprofit focused on flood-risk research, estimates that about 14.6 million properties nationwide face substantial flood risk. That's significantly higher than the roughly 8.7 million properties FEMA's maps flag as high-risk.[2]

Millions of homes, in other words, sit in a blind spot. They're genuinely exposed to flooding, but not required to carry insurance for it.

That blind spot isn't theoretical. Roughly two-thirds of the homes that flooded in Harris County, Texas, during Hurricane Harvey were outside FEMA's designated high-risk zone. A 2025 Consumer Financial Protection Bureau (CFPB) analysis of flooding tied to Hurricanes Helene and Milton found similar patterns across Florida, Georgia, and western North Carolina, particularly in Appalachian communities that FEMA's maps never flagged as flood-prone.

The CFPB estimated more than 400,000 properties in the Southeast and Central Southwest may be underinsured relative to their actual flood exposure.[3]

Local remapping efforts illustrate just how stale some of this data gets. In Lee County, Florida, the original flood map dated to 1984, and more than 20 years passed before it saw a meaningful update. Officials there have noted that maps drawn decades ago struggle to keep up with how fast land use and climate conditions are changing.[4]

Why Do So Few Homeowners Have Coverage?

Standard homeowners insurance doesn't cover flood damage. Flood coverage has to be purchased separately, either through the NFIP or a private flood insurer.

Because that requirement is triggered mainly by FEMA's outdated maps, a huge share of at-risk homeowners simply don't buy it. The numbers show how wide the gap is.

Only about 4% of U.S. homeowners carry flood insurance nationwide, even though flooding is involved in roughly 90% of natural disasters in the country.[5] 

Even in the highest-risk zones, only about 30% of homes carry flood coverage, according to research from the Wharton School's Risk Management and Decision Processes Center.[6] 

The consequences show up after every major flood event. The central Texas flooding of July 2025 caused an estimated $18 billion to $22 billion in economic damage, with flood insurance take-up in the affected areas estimated at 5% or lower. Most of the loss fell on homeowners without any flood coverage at all.[7] 

Cost is part of the story, too. FEMA's Risk Rating 2.0 pricing system, rolled out in 2021, moved premiums closer to each property's actual risk. That's made coverage more accurate, but it's also driven steep increases for many policyholders.

FEMA has estimated that roughly 77% of policyholders now pay more than they would have under the old system.[8] Research published in late 2025 found that as many as 13% of homeowners facing the largest increases dropped their policies entirely.[9]

The people priced out are disproportionately lower-income homeowners in high-risk areas — the same group least able to absorb an uninsured flood loss.


What Can Homeowners Do?

Waiting for FEMA's maps to catch up isn't a strategy.

A few steps can help homeowners get a clearer, more current picture of their actual risk:


  1. Check a property's Flood Factor. Tools like First Street's Flood Factor, available free through Realtor.com and other sites, model flood risk using rainfall, elevation, and climate projections rather than relying solely on FEMA's static zones.
  2. Don't assume "not in a flood zone" means "no flood risk." A large share of flood claims comes from properties outside FEMA's designated high-risk areas.
  3. Compare NFIP and private flood insurance. Private insurers often use more current risk models, and coverage limits can be substantially higher than the NFIP's $250,000 building and $100,000 contents caps.
  4. Reassess coverage after a local flood map update. Zone changes can shift both requirements and pricing, and they're a good trigger to re-shop coverage.
  5. Factor flood risk into home-buying decisions, even in areas with no recent flood history. Rainfall-driven and inland flooding are both becoming more common outside the areas that maps have traditionally flagged.

None of these steps takes the place of an official flood zone determination. But together, they give homeowners a far more current read on their risk than a map alone can offer.

us capitol

An Unstable Program on Top of an Outdated Map

Adding to the uncertainty, the NFIP itself operates on a patchwork of short-term extensions rather than a stable, long-term authorization. The program has been renewed more than 35 times in short bursts since 2017.

That patchwork includes a lapse during the 2025 federal shutdown that froze new and renewed policies for weeks. Its current authorization runs through September 30, 2026, and another lapse would once again pause new flood insurance sales nationwide, right as flood risk keeps climbing.[10]

Final Thoughts

FEMA's maps will keep getting updated, but no map can move as fast as the weather it's trying to predict. Homeowners who wait for an official redraw before taking flood risk seriously are often a step behind.

A five-minute risk check today is a lot cheaper than an uninsured flood claim tomorrow. The maps are a starting point, not the final word on whether a home is safe.


Sources
  1. Federal Flood Maps Are Outdated Because of Climate Change, FEMA Director Says. Smithsonian magazine

    Federal Flood Maps Are Outdated Because of Climate Change, FEMA Director Says. Smithsonian magazine

  2. First Street Foundation releases new data disclosing the flood risk of every home in the contiguous U.S. First Street Foundation

    First Street Foundation releases new data disclosing the flood risk of every home in the contiguous U.S. First Street Foundation

  3. Flood Risk and the U.S. Mortgage Market. CFPB

    Flood Risk and the U.S. Mortgage Market. CFPB

  4. Why FEMA redraws flood maps and what it means for Lee County. WGCU News

    Why FEMA redraws flood maps and what it means for Lee County. WGCU News

  5. Can FEMA and Flood Insurance Keep Up with the Rising Tide of Risks? U.S. GAO

    Can FEMA and Flood Insurance Keep Up with the Rising Tide of Risks? U.S. GAO

  6. Closing the Flood Insurance Gap. The Wharton School

    Closing the Flood Insurance Gap. The Wharton School

  7. Independence Day flash flood tragedy in Texas causes an estimated $18 billion to $22 billion in total damage and economic loss. AccuWeather

    Independence Day flash flood tragedy in Texas causes an estimated $18 billion to $22 billion in total damage and economic loss. AccuWeather

  8. National Flood Insurance Program: The Current Rating Structure and Risk Rating 2.0. Congress.gov

    National Flood Insurance Program: The Current Rating Structure and Risk Rating 2.0. Congress.gov

  9. Study Finds FEMA’s New Flood Insurance Pricing Is Improving Risk Signals but Reducing Coverage. EDF

    Study Finds FEMA’s New Flood Insurance Pricing Is Improving Risk Signals but Reducing Coverage. EDF

  10. What Happens If the National Flood Insurance Program (NFIP) Lapses? Congress.gov

    What Happens If the National Flood Insurance Program (NFIP) Lapses? Congress.gov